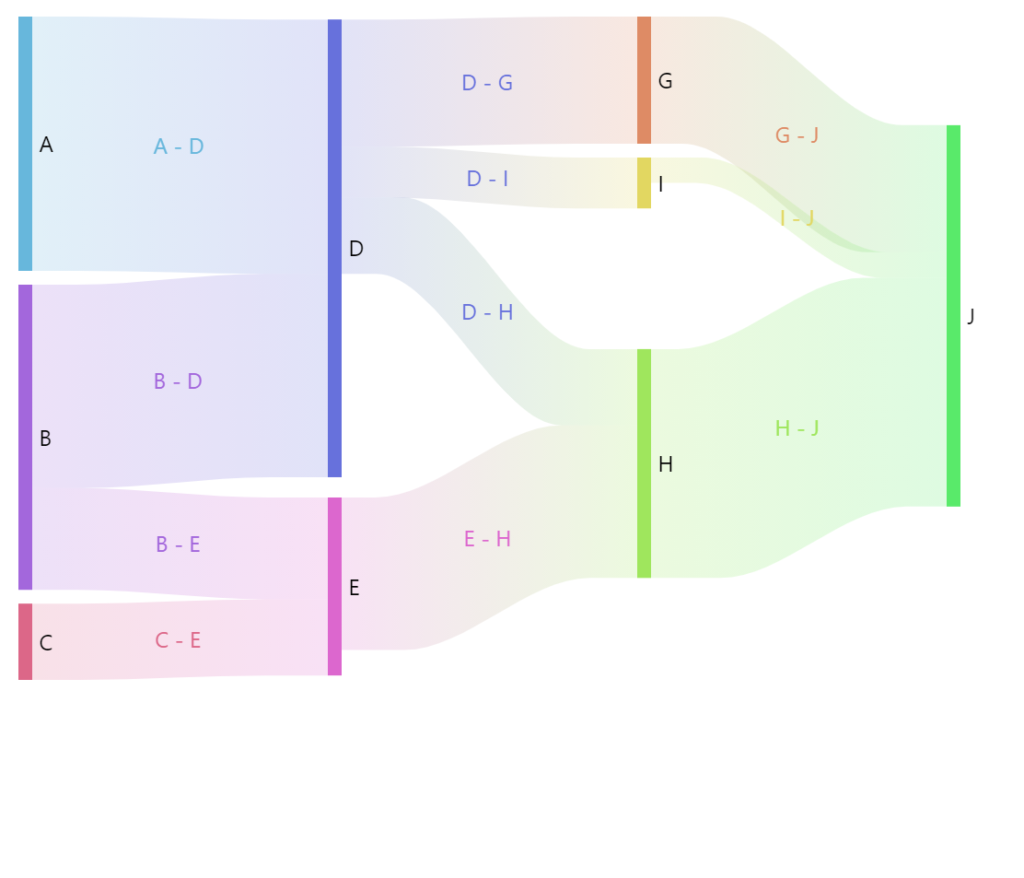
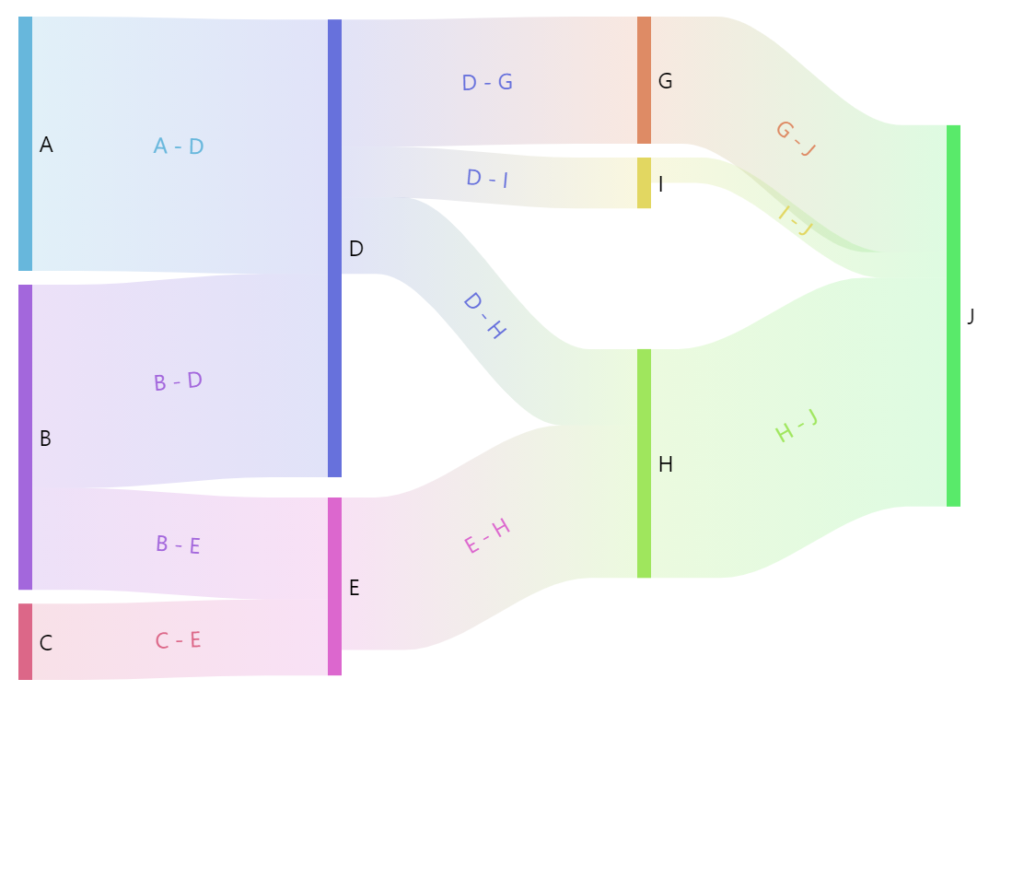
This tutorial will look at how we can use bullets on flow charts.
Adding bullets
Flow charts are basically series, so bullets are added just like with any other series: by pushing bullet creation function into series' bullets list:
series.bullets.push(function(root, series, dataItem) {
  return am5.Bullet.new(root, {
    sprite: am5.Circle.new(root, {
      radius: 5,
      fill: am5.color(0x000000)
    })
  });
});
series.bullets.push(function(root, series, dataItem) {
  return am5.Bullet.new(root, {
    sprite: am5.Circle.new(root, {
      radius: 5,
      fill: am5.color(0x000000)
    })
  });
});
This will add a bullet on each link in series.
Location within link
By default, bullets will appear at the start of the link.
We can use bullet's setting locationX or locationY to specify relative location within the span of the link.
Chord bullets will always use locationY.
Sankey bullets will depend on its orientation: horizontal Sankey bullets will use locationX, whereas vertical one will need their bullets to use locationY.
It accepts numeric values from 0 (one, which means beginning of the link) and 1 (one, which means end of the link).
The following will place bullets in the middle of the Sankey links:
series.bullets.push(function(root, series, dataItem) {
  return am5.Bullet.new(root, {
    location: 0.5,
    sprite: am5.Circle.new(root, {
      radius: 5,
      fill: am5.color(0x000000)
    })
  });
});
series.bullets.push(function(root, series, dataItem) {
  return am5.Bullet.new(root, {
    location: 0.5,
    sprite: am5.Circle.new(root, {
      radius: 5,
      fill: am5.color(0x000000)
    })
  });
});
Inheriting bullet color
Whenever bullet creation function kicks in, it will receive a related series data item (link) as a third parameter.
We can use it to either access link's color, or a color of a source or destination nodes.
The following will use fill of the link's source node:
series.bullets.push(function(root, series, dataItem) {
  return am5.Bullet.new(root, {
    locationX: 0.5,
    sprite: am5.Circle.new(root, {
      radius: 5,
      fill: dataItem.get("source").get("fill")
    })
  });
});
series.bullets.push(function(root, series, dataItem) {
  return am5.Bullet.new(root, {
    locationX: 0.5,
    sprite: am5.Circle.new(root, {
      radius: 5,
      fill: dataItem.get("source").get("fill")
    })
  });
});
Relative rotation
A flow bullet can also be rotated automatically to follow the direction of the link in the location of the bullet.
It doesn't matter for a circle bullet, but might make perfect sense for other shapes, e.g. a triangle or a label.
We have a bullet setting autoRotate (default: false) for that:
series.bullets.push(function(root, series, dataItem) {
  return am5.Bullet.new(root, {
    locationX: 0.5,
    autoRotate: true,
    sprite: am5.Label.new(root, {
      text: "{sourceId} - {targetId}",
      fill: dataItem.get("source").get("fill"),
      centerX: am5.percent(50),
      textAlign: "middle",
      populateText: true
    })
  });
});

autoRotate: false (default)
autoRotate: trueSee the Pen Sankey diagram with bullets by amCharts team (@amcharts) on CodePen.
Relative rotation can also be further tweaked using another bullet setting: autoRotateAngle.
If set, it will add additional degrees to the angle, calculated automatically.
The following will create triangle arrowheads for bullets, and the autoRotateAngle: 180 will make the point backwards:
series.bullets.push(function(root, series, dataItem) {
  return am5.Bullet.new(root, {
    locationX: 0.5,
    autoRotate: true,
    autoRotateAngle: 180,
    sprite: am5.Graphics.new(root, {
    fill: dataItem.get("source").get("fill"),
      centerY: am5.percent(50),
      centerX: am5.percent(50),
      draw: function (display) {
        display.moveTo(0, -6);
        display.lineTo(16, 0);
        display.lineTo(0, 6);
        display.lineTo(0, -6);
      }
    })
  });
});
See the Pen Sankey diagram with bullets by amCharts team (@amcharts) on CodePen.
Dynamic updates and animation
We can update any bullet setting, including locationX/locationY, dynamically.
bullet.set("locationX", 0.8);
bullet.set("locationX", 0.8);
We can also animate settings by creating a setting animation:
bullet.animate({
  key: "locationX",
  to: 0.8,
  from: 0.2,
  duration: Math.random() * 1000 + 2000,
  loops: Infinity,
  easing: am5.ease.quad
});
bullet.animate({
  key: "locationX",
  to: 0.8,
  from: 0.2,
  duration: Math.random() * 1000 + 2000,
  loops: Infinity,
  easing: am5.ease.quad
});
See the Pen Sankey diagram with bullets by amCharts team (@amcharts) on CodePen.