Map polygon series are responsible for drawing actual map areas (countries, regions, etc.). This tutorial takes a look at various angles we can use them.
Adding series
To create a map polygon series we need to call its new() method and push the new object into chart's series list:
let polygonSeries = chart.series.push(
  am5map.MapPolygonSeries.new(root, {
    geoJSON: am5geodata_worldLow
  })
);
var polygonSeries = chart.series.push(
  am5map.MapPolygonSeries.new(root, {
    geoJSON: am5geodata_worldLow
  })
);
Data
As with any series, polygon series needs some kind of data to operate.
In case of a map series it can be either GeoJSON format or a plain data format.
Geodata/GeoJSON
The GeoJSON data is set via series geodata setting.
amCharts 5 has a number of various country and region maps in a separate geodata package available as a downloadable ZIP file, NPM package, or CDN.
File locations and naming for specific maps, as well as various detail version is described in main "Map chart: Geodata (maps)" tutorial. Please make sure to visit it for reference.
Ads an example, let's load a map of France:
import worldLow from "@amcharts/amcharts5/geodata/franceLow";
<script src="https://cdn.amcharts.com/lib/5/geodata/franceLow.js"></script>
Then use it for a polygon series:
let polygonSeries = chart.series.push(
  am5map.MapPolygonSeries.new(root, {
    geoJSON: am5geodata_franceLow
  })
);
var polygonSeries = chart.series.push(
  am5map.MapPolygonSeries.new(root, {
    geoJSON: am5geodata_franceLow
  })
);
Plain data
It's also possible to pass in generic data to series via its data property.
The items in map polygon series need to be in GeoJSON geometry format, e.g.:
let polygonSeries = chart.series.push(
  am5map.MapPolygonSeries.new(root, {})
);
polygonSeries.data.push({
  geometry: {
    type: "Polygon",
    coordinates: [
      [
        [26.5936, 55.6676],
        [26.175, 55.0033],
        [25.8594, 54.9192],
        [25.5473, 54.3317],
        [24.7683, 53.9746],
        [23.4845, 53.9398],
        [23.37, 54.2005],
        [22.7663, 54.3568],
        [22.8311, 54.8384],
        [21.2358, 55.2641],
        [21.0462, 56.07],
        [22.0845, 56.4067],
        [24.1206, 56.2642],
        [24.9032, 56.3982],
        [26.5936, 55.6676]
      ]
    ]
  }
});
The above will create a polygon series with a rough outline of Lithuania as a single polygon in it.
amCharts 5 also comes with some handy utility functions, that can generate geometry data for a square or a circle:
| Function | Comment |
|---|---|
am5map.getGeoCircle(geoPoint, radius) | Returns a geography data representing a circle with a center at specific latitude/longitude (first parameter) and radius (degrees). |
am5map.getGeoRectangle(north, east, south, west) | Returns a geography data representing a square with boundaries at passed in via the four parameters. |
Here's how we would put a circle-shaped polygon, over Paris, France:
let polygonSeries = chart.series.push(
  am5map.MapPolygonSeries.new(root, {})
);
polygonSeries.data.push({
  geometry: am5map.getGeoCircle({ latitude: 48.86, longitude: 2.35 }, 2)
});
var polygonSeries = chart.series.push(
  am5map.MapPolygonSeries.new(root, {})
);
polygonSeries.data.push({
  geometry: am5map.getGeoCircle({ latitude: 48.86, longitude: 2.35 }, 2)
});
NOTE Regardless of how we add data to the polygon series, it will be reshaped according to the projection used on the map.
Using geodata and data together
It's also possible to set both geodata and data. It's a good way to supplement geodata with additional values and other properties via data.
Polygon series will automatically merge data located in both data sources using id field as a binding link.
For example, we can assign name and value to certain polygons from geodata using entries in data:
let polygonSeries = chart.series.push(
  am5map.MapPolygonSeries.new(root, {
    geoJSON: am5geodata_worldLow
  })
);

polygonSeries.data.setAll([{
  id: "FR",
  name: "France",
  value: 100
}, {
  id: "ES",
  name: "Spain",
  value: 200
}]);
var polygonSeries = chart.series.push(
  am5map.MapPolygonSeries.new(root, {
    geoJSON: am5geodata_worldLow
  })
);

polygonSeries.data.setAll([{
  id: "FR",
  name: "France",
  value: 100
}, {
  id: "ES",
  name: "Spain",
  value: 200
}]);
Now, the series will use items from worldLow map, but will also attach additional value to France and Spain, as well as override their name attribute.
IMPORTANT It's a good practice to make sure that setting data happens as late into code as possible. Once you set data, all related objects are created, so any configuration settings applied afterwards might not carry over.
Configuring polygon appearance
Polygon appearance can be configured via its template, accessible via series' mapPolygons.template.
A polygon is an object of type MapPolygon. Any of its settings can be set via template.
polygonSeries.mapPolygons.template.setAll({
  stroke: am5.color(0xffffff),
  strokeWidth: 2,
  fillOpacity: 0.5
});
polygonSeries.mapPolygons.template.setAll({
  stroke: am5.color(0xffffff),
  strokeWidth: 2,
  fillOpacity: 0.5
});
Polygon fill and outline colors can also be set directly via polygon series' settings fill and stroke:
let polygonSeries = chart.series.push(
  am5map.MapPolygonSeries.new(root, {
    geoJSON: am5geodata_worldLow,
    fill: am5.color(0x22ff55),
    stroke: am5.color(0xffffff)
  })
);
var polygonSeries = chart.series.push(
  am5map.MapPolygonSeries.new(root, {
    geoJSON: am5geodata_worldLow,
    fill: am5.color(0x22ff55),
    stroke: am5.color(0xffffff)
  })
);
Binding to data
Polygons can take values for theirs settings from data as well, using template fields.
Template fields allow binding an object's properties in series' data, to polygon template's settings.
polygonSeries.mapPolygons.template.setAll({
  tooltipText: "{name}",
  templateField: "polygonSettings"
});
polygonSeries.mapPolygons.template.setAll({
  tooltipText: "{name}",
  templateField: "polygonSettings"
});
An here's how the data on series might look like if we wanted to add specific color for Canada, United States, and Mexico:
polygonSeries.data.setAll([{
  id: "US",
  polygonSettings: {
    fill: am5.color(0xFF3C38)
  }
}, {
  id: "CA",
  polygonSettings: {
    fill: am5.color(0xA23E48)
  }
}, {
  id: "MX",
  polygonSettings: {
    fill: am5.color(0xFF8C42)
  }
}])
polygonSeries.data.setAll([{
  id: "US",
  polygonSettings: {
    fill: am5.color(0xFF3C38)
  }
}, {
  id: "CA",
  polygonSettings: {
    fill: am5.color(0xA23E48)
  }
}, {
  id: "MX",
  polygonSettings: {
    fill: am5.color(0xFF8C42)
  }
}])
See the Pen Using templateDield in MapPolygonSeries by amCharts team (@amcharts) on CodePen.
Hover behavior
Adding tooltips
To add a tooltip to the polygons, we can use tooltipText on polygon template. We can set tooltipText along any other polygon's settings.
The value may contain data placeholders as well as in-line text styles.
polygonSeries.mapPolygons.template.setAll({
  tooltipText: "{name}"
});
polygonSeries.mapPolygons.template.setAll({
  tooltipText: "{name}"
});
Hover states
We can set setting values to apply to polygons when it is hovered by creating a "hover" state for it.
polygonSeries.mapPolygons.template.setAll({
  tooltipText: "{name}",
  interactive: true
});

polygonSeries.mapPolygons.template.states.create("hover", {
  fill: am5.color(0x677935)
});
polygonSeries.mapPolygons.template.setAll({
  tooltipText: "{name}",
  interactive: true
});

polygonSeries.mapPolygons.template.states.create("hover", {
  fill: am5.color(0x677935)
});
NOTE Adding a "hover" state does not automatically turn on interactivity for the element, so we need to do that manually by setting its interactive setting to true.
See the Pen Map chart by amCharts team (@amcharts) on CodePen.
Click events
If we need to handle a click event on series' polygons, we can add it to its template, too:
polygonSeries.mapPolygons.template.events.on("click", function(ev) {
  console.log("Clicked on", ev.target.dataItem.get("name"));
});
polygonSeries.mapPolygons.template.events.on("click", function(ev) {
  console.log("Clicked on", ev.target.dataItem.get("name"));
});
This can be used to add click-through to polygons, by adding target URL into data:
polygonSeries.data.setAll([{
  id: "US",
  url: "https://en.wikipedia.org/wiki/United_States"
}, {
  id: "CA",
  url: "https://en.wikipedia.org/wiki/Canada"
}, {
  id: "MX",
  url: "https://en.wikipedia.org/wiki/Mexico"
}]);
polygonSeries.data.setAll([{
  id: "US",
  url: "https://en.wikipedia.org/wiki/United_States"
}, {
  id: "CA",
  url: "https://en.wikipedia.org/wiki/Canada"
}, {
  id: "MX",
  url: "https://en.wikipedia.org/wiki/Mexico"
}]);
And implementing the "click" event handler:
polygonSeries.mapPolygons.template.events.on("click", function(ev) {
  const url = ev.target.dataItem.dataContext.url;
  if(url) {
    window.location.href = ev.target.dataItem.dataContext.url;
  }
});
polygonSeries.mapPolygons.template.events.on("click", function(ev) {
  var url = ev.target.dataItem.dataContext.url;
  if(url) {
    window.location.href = ev.target.dataItem.dataContext.url;
  }
});
Excluding or including polygons
Series can be set up to either exclude certain polygons out of the loaded geodata, or only include specific ones.
To exclude polygons use series setting exclude, which is an array of polygon ids:
let polygonSeries = chart.series.push(
  am5map.MapPolygonSeries.new(root, {
    geoJSON: worldLow,
    exclude: ["AQ"]
  })
);
var polygonSeries = chart.series.push(
  am5map.MapPolygonSeries.new(root, {
    geoJSON: worldLow,
    exclude: ["AQ"]
  })
);
The above will remove Antarctica from the map.
If we'd like to include only specific polygons from map, we can use include setting instead:
let polygonSeries = chart.series.push(
  am5map.MapPolygonSeries.new(root, {
    geoJSON: worldLow,
    include: ["US", "CA", "MX"]
  })
);
var polygonSeries = chart.series.push(
  am5map.MapPolygonSeries.new(root, {
    geoJSON: worldLow,
    include: ["US", "CA", "MX"]
  })
);
The above will shown countries from North America, even though worldLow contains all the countries of the world.
Overlaid polygon series
Map chart allows any number of series to be added.
We can use several series with different geodata to create hybrid maps, for example a world map with U.S. state subdivisions:
let worldSeries = chart.series.push(
  am5map.MapPolygonSeries.new(root, {
    geoJSON: worldLow,
    exclude: ["AQ"]
  })
);

let usaSeries = chart.series.push(
  am5map.MapPolygonSeries.new(root, {
    geoJSON: usaLow
  })
);
var worldSeries = chart.series.push(
  am5map.MapPolygonSeries.new(root, {
    geoJSON: worldLow,
    exclude: ["AQ"]
  })
);

var usaSeries = chart.series.push(
  am5map.MapPolygonSeries.new(root, {
    geoJSON: usaLow
  })
);
Background polygon
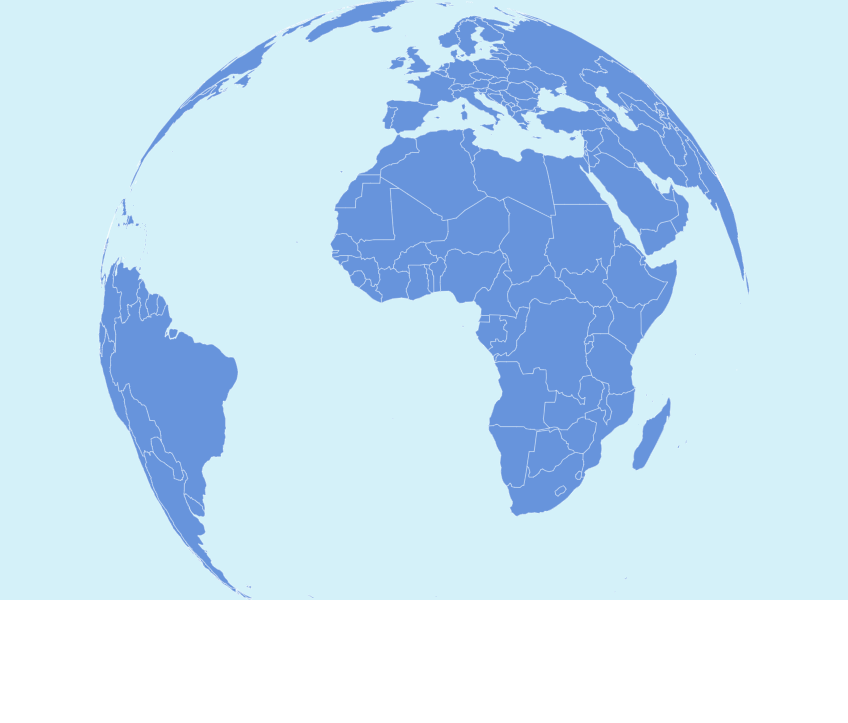
We can set background fill color for our map chart by creating a background rectangle on the chart itself:
chart.chartContainer.set("background", am5.Rectangle.new(root, {
  fill: am5.color(0xd4f1f9),
  fillOpacity: 1
}));
chart.chartContainer.set("background", am5.Rectangle.new(root, {
  fill: am5.color(0xd4f1f9),
  fillOpacity: 1
}));
While it may work for some maps, it might look awkward for others, because chart background is just a square and is not affected by projection.
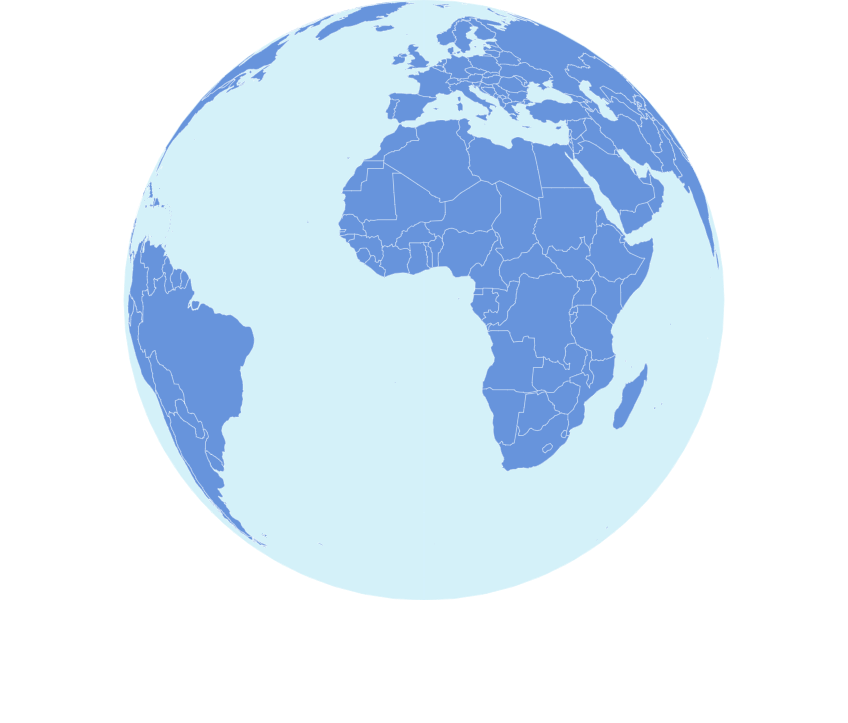
To create a true background, which would follow projection, we can create a separate polygon series with a single item - a square spanning the whole scope of longitude and latitude of the world.
We can create the square geometry using helper function am5map.getGeoRectangle():
let backgroundSeries = chart.series.unshift(
  am5map.MapPolygonSeries.new(root, {})
);

backgroundSeries.mapPolygons.template.setAll({
  fill: am5.color(0xd4f1f9),
  stroke: am5.color(0xd4f1f9),
});

backgroundSeries.data.push({
  geometry: am5map.getGeoRectangle(90, 180, -90, -180)
});
var backgroundSeries = chart.series.unshift(
  am5map.MapPolygonSeries.new(root, {})
);

backgroundSeries.mapPolygons.template.setAll({
  fill: am5.color(0xd4f1f9),
  stroke: am5.color(0xd4f1f9),
});

backgroundSeries.data.push({
  geometry: am5map.getGeoRectangle(90, 180, -90, -180)
});
NOTE Series follow the order in which they were added to the chart. To ensure that background series is in the back, we need to add it first, or (as per code snippet above) we can ensure that it is inserted at index zero using unshift() method instead of push().
See the Pen Map chart by amCharts team (@amcharts) on CodePen.