This tutorial looks at what is involved in creating candlestick and OHLC series.
Creating
Both series are fairly identical in functionality.
Candlestick series are instantiated using CandlestickSeries class, whereas OHLC ones use OHLCSeries.
The difference between candlestick/OHLC and other XY series, is that the former require four numeric input data fields, rather than one:
| Data field | Comment |
|---|---|
openValueXField or openValueYField | Field for open value. |
highValueXField or highValueYField | Field for high (top wick) value. |
lowValueXField or lowValueYField | Field for low (bottom wick) value. |
valueXField or valueYField | Field for close value. |
To create a series, use new() method of the respective series class, and push it into chart's series list:
let series = chart.series.push(
  am5xy.Candlestick.new(root, {
    name: "Series",
    xAxis: xAxis,
    yAxis: yAxis,
    openValueYField: "open",
    highValueYField: "high",
    lowValueYField: "low",
    valueYField: "close",
    valueXField: "date"
  })
);
var series = chart.series.push(
  am5xy.Candlestick.new(root, {
    name: "Series",
    xAxis: xAxis,
    yAxis: yAxis,
    openValueYField: "open",
    highValueYField: "high",
    lowValueYField: "low",
    valueYField: "close",
    valueXField: "date"
  })
);
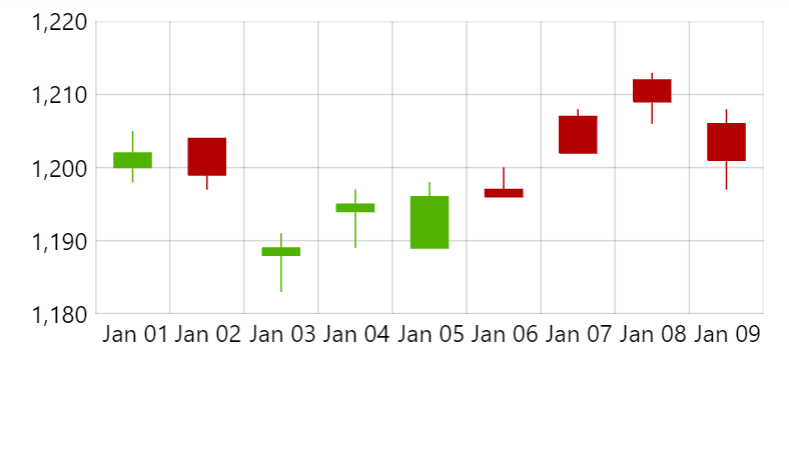
CandlestickSeries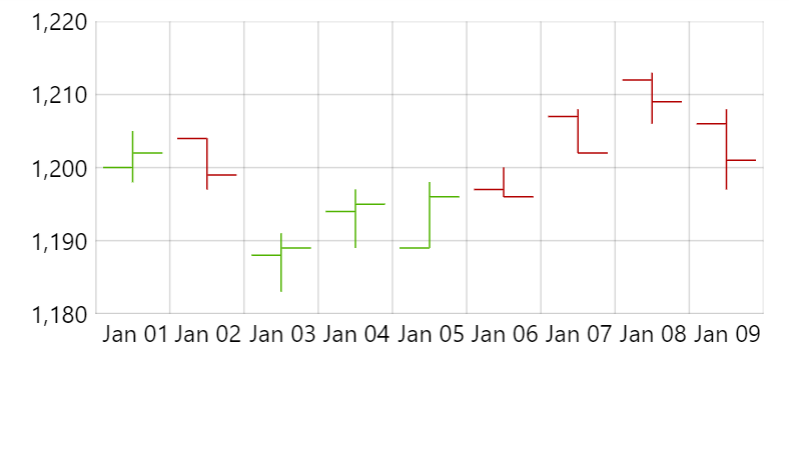
OHLCSeriesSee the Pen Series tooltips and cursor by amCharts team (@amcharts) on CodePen.
Configuring appearance
Stroke and fill colors
Both candlestick and OHLC series have different approach to colors than the rest of the XY chart series.
While they still get assigned stroke and fill color from the theme that are used for such auxiliary elements as tooltips, they do apply their own colors based on the close value relation to open value.
Basically, if the open value is lower than close, the candle/stick will be green. If it's the other way around, the candle/stick will be red.
Using other themes may introduce different coloring scheme.
Actual color application in these series is done by applying certain state to candle/stick.
It is done by the series based on actual open/close values of each data item.
If close value is bigger than open, a riseFromOpen state is applied to the candle/stick.
And vice versa, if close value is lower than open, a dropFromOpen state is applied to the candle/stick.
Default theme defines different fill and stroke colors for these two states. That's how candles/sticks get their value-dependent coloring.
Modifying colors
If we want to modify these positive/negative colors, we can override default states by creating our own ones on a series' columns.template:
series.columns.template.states.create("riseFromOpen", {
  fill: am5.color(0x76b041),
  stroke: am5.color(0x76b041)
});

series.columns.template.states.create("dropFromOpen", {
  fill: am5.color(0xe4572e),
  stroke: am5.color(0xe4572e)
});
series.columns.template.states.create("riseFromOpen", {
  fill: am5.color(0x76b041),
  stroke: am5.color(0x76b041)
});

series.columns.template.states.create("dropFromOpen", {
  fill: am5.color(0xe4572e),
  stroke: am5.color(0xe4572e)
});
Naturally, we can also create a quick theme:
const myTheme = am5.Theme.new(root);

myTheme.rule("Candlestick").states.create("riseFromOpen", {
  fill: am5.color(0x76b041),
  stroke: am5.color(0x76b041)
});

myTheme.rule("Candlestick").states.create("dropFromOpen", {
  fill: am5.color(0xe4572e),
  stroke: am5.color(0xe4572e)
});

root.setThemes([
  myTheme
]);
var myTheme = am5.Theme.new(root);

myTheme.rule("Candlestick").states.create("riseFromOpen", {
  fill: am5.color(0x76b041),
  stroke: am5.color(0x76b041)
});

myTheme.rule("Candlestick").states.create("dropFromOpen", {
  fill: am5.color(0xe4572e),
  stroke: am5.color(0xe4572e)
});

root.setThemes([
  myTheme
]);
Disabling value-dependent coloring
The coloring for the candlestick series comes from default theme. It targets candles/sticks via their themeTags setting, which (in case of candlestick series) is preset to ["autocolor"].
If we don't want any value-sensitive coloring applied, we can simply remove that setting:
series.columns.template.set("themeTags", []);
series.columns.template.set("themeTags", []);
Other appearance settings
We can also use the same columns.template to apply other non-color settings, e.g. strokeWidth:
series.columns.template.setAll({
  strokeWidth: 2
});
series.columns.template.setAll({
  strokeWidth: 2
});
Candle width
Candles/sticks take up 80% of the available width by default.
This can be changed using columns.template's width setting which can either be relative percent value, or an absolute pixel value:
series.columns.template.setAll({
  width: am5.percent(60)
});
series.columns.template.setAll({
  width: am5.percent(60)
});
For more information about this, refer to "Column series: Column width" tutorial.
Professional candlesticks
amCharts also supports "professional" or "hollow" candlesticks.
They might look similar to regular ones, but their coloring logic is quite different.
They can be either solid or hollow:
- SOLID candle means that its closing value is LOWER than opening value of the same period.
- HOLLOW candle means that its closing value is HIGHER (or EQUAL) than opening value of the same period.
Coloring is based on closing price in comparison to previous period:
- GREEN (or equivalent as per theme) means that its closing value is HIGHER (or EQUAL) than the closing value of the previous period.
- RED (or equivalent as per theme) means that its closing value is LOWER than the closing value of the previous period.
Default theme has it covered, already. All we have to do is to push a "pro" tag into column template's themeTags:
series.columns.template.get("themeTags").push("pro");
series.columns.template.get("themeTags").push("pro");
See the Pen Candlestick series by amCharts team (@amcharts) on CodePen.