Graticule is a special kind of map series that will draw a map grid.
Adding
To add a graticule grid to map we need to do two things:
- Add
GraticuleSeriesinstance to map. - Configure its line settings.
let graticuleSeries = chart.series.unshift(
  am5map.GraticuleSeries.new(root, {})
);

graticuleSeries.mapLines.template.setAll({
  stroke: am5.color(0x000000),
  strokeOpacity: 0.1
});
var graticuleSeries = chart.series.unshift(
  am5map.GraticuleSeries.new(root, {})
);

graticuleSeries.mapLines.template.setAll({
  stroke: am5.color(0x000000),
  strokeOpacity: 0.1
});
The unshift() call above is used to insert graticule series at the beginning of the series list so it stays behind all the other series we may have.
Please note that graticule series is actually a line series under the hood. Please refer to the "Map line series" tutorial for further info on how to configure appearance of the lines.
See the Pen Map chart with orthographic projection (globe) by amCharts team (@amcharts) on CodePen.
Grid density
Normally. graticule series places a line every 10 degrees of latitude and longitude.
We can change the density using series' step setting:
let graticuleSeries = chart.series.unshift(
  am5map.GraticuleSeries.new(root, {
    step: 20
  })
);
var graticuleSeries = chart.series.unshift(
  am5map.GraticuleSeries.new(root, {
    step: 20
  })
);
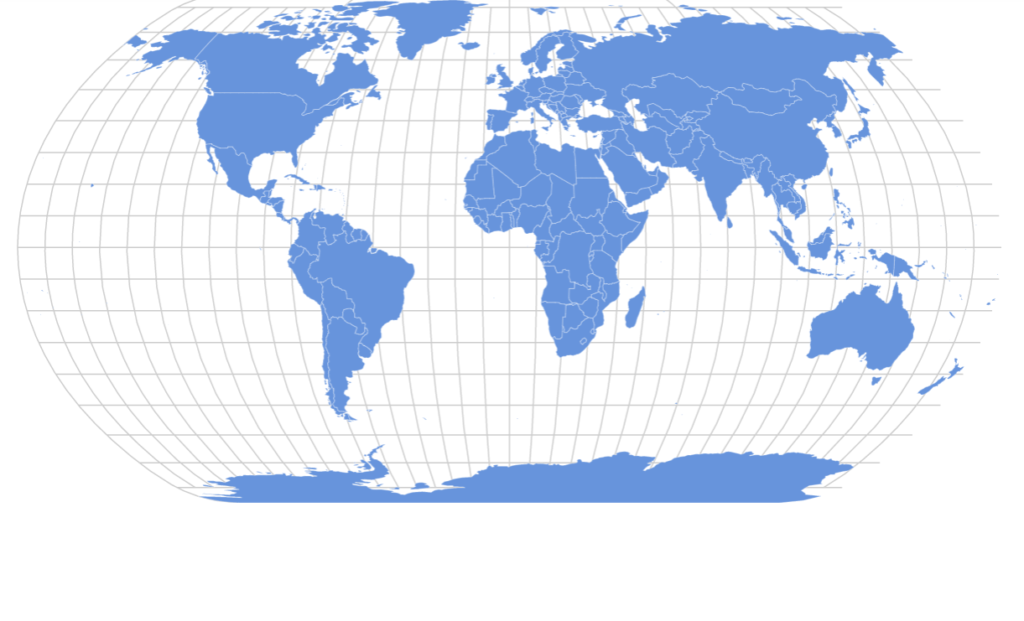
step: 10 (default)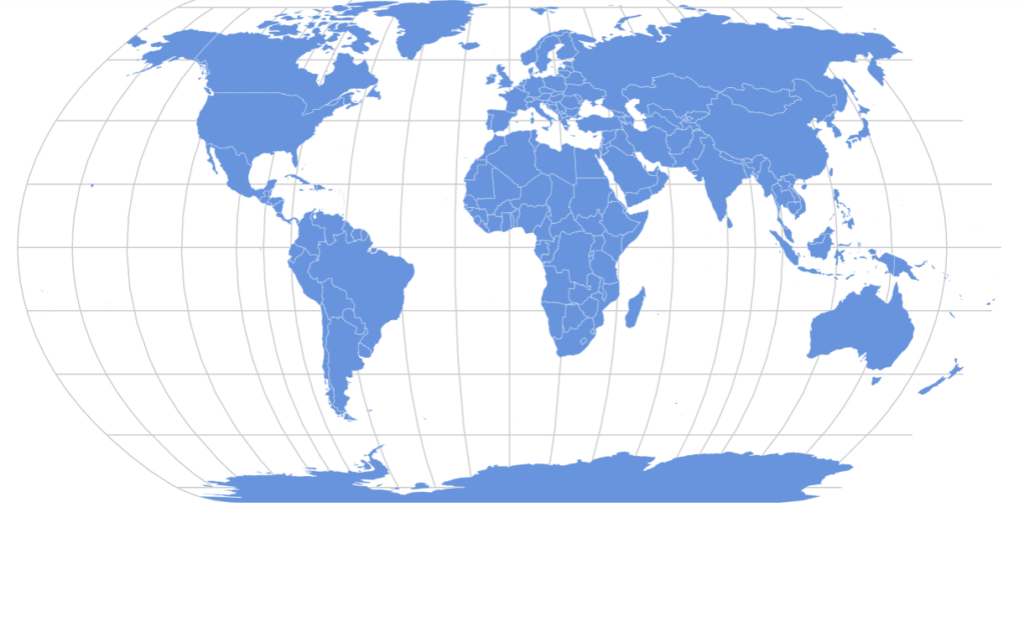
step: 20
step: 5