Legend is a universal control that can be used on virtually any chart type, fed by series or other sources. This tutorial will cover common techniques of using a legend.
Adding
We create a legend just like any other visual element: by calling its class' new() method and pushing it to some sore of container, most commonly a chart:
let legend = chart.children.push(am5.Legend.new(root, {}));
legend.data.setAll(chart.series.values);
var legend = chart.children.push(am5.Legend.new(root, {}));
legend.data.setAll(chart.series.values);
Legend data
As per code snipped above, legend data is set via its data property.
It has a number of methods to add single or a few data items at once.
For more information, refer to the "Data" tutorial.
Now, let's take a look at two types of data we can set on legend.
Data item list
The most common and convenient way is to pass in an array of DataItem objects.
The good news is that most things that may be represented by legend already have such list readily available.
For example, chart's series property is a list, which has values property, which is an array of data items representing each series.
We can use that to automatically feed the legend:
legend.data.setAll(chart.series.values);
legend.data.setAll(chart.series.values);
Or, if we would like each data item in series to have its own legend item, we can use series' dataItems property, which too is an array of data items:
legend.data.setAll(series.dataItems);
legend.data.setAll(series.dataItems);
Please note, that non-standard setups might need a little extra configuration.
For example if we would try to use column series' data items as data for the legend, we would need to specify which data field holds the name to use in legend:
let legend = chart.children.push(am5.Legend.new(root, {
  nameField: "categoryX"
}));

legend.data.setAll(series.dataItems);
var legend = chart.children.push(am5.Legend.new(root, {
  nameField: "categoryX"
}));

legend.data.setAll(series.dataItems);
Here's an example of legend feed its items from actual columns in a column series:
See the Pen Stacked column chart by amCharts team (@amcharts) on CodePen.
NOTE Not all series types support passing in their data items as data for the legend. For example, LineSeries does not have notion of fill for each individual data item, so it won't work for legend.
For a more advanced version of the above demo (with hover support), check out "Individual legend item for each column in series".
Standalone data
Another option to supply data to legend is via plain array of objects, e.g.:
let legend = chart.children.push(am5.Legend.new(root, {
  nameField: "name",
  fillField: "color",
  strokeField: "color",
  centerX: am5.percent(50),
  x: am5.percent(50)
}));

legend.data.setAll([{
  name: "Under budget",
  color: am5.color(0x297373)
}, {
  name: "Over budget",
  color: am5.color(0xff621f)
}]);
var legend = chart.children.push(am5.Legend.new(root, {
  nameField: "name",
  fillField: "color",
  strokeField: "color",
  centerX: am5.percent(50),
  x: am5.percent(50)
}));

legend.data.setAll([{
  name: "Under budget",
  color: am5.color(0x297373)
}, {
  name: "Over budget",
  color: am5.color(0xff621f)
}]);
Since we are supplying completely custom data, we will need to specify which keys in data hold item name and colors using nameField, fillField, and strokeField respectively.
See the Pen Legend with column series data items by amCharts team (@amcharts) on CodePen.
Positioning
Legend does not have any specific position setting.
Where it is placed is determined by the layout setting of parent container.
In most chart setups, legend container will be chart itself.
By default, chart does not have any layout, so pushing a legend will just plop it on the top. It will also not affect size of the plot itself.
If we need to arrange chart and legend neatly, in a non-overlapping, orderly way, we need to add a layout setting to the chart.
let chart = root.container.children.push(
  am5percent.PieChart.new(root, {
    layout: root.verticalLayout
  })
);

let legend = chart.children.push(am5.Legend.new(root, {}));
var chart = root.container.children.push(
  am5percent.PieChart.new(root, {
    layout: root.verticalLayout
  })
);

var legend = chart.children.push(am5.Legend.new(root, {}));
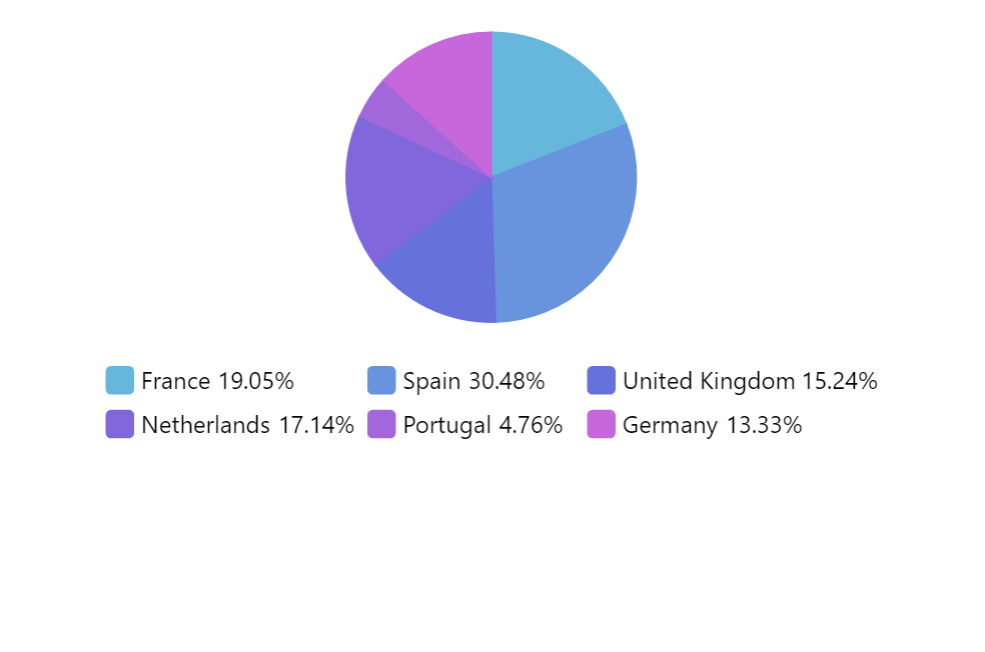
layout: root.verticalLayout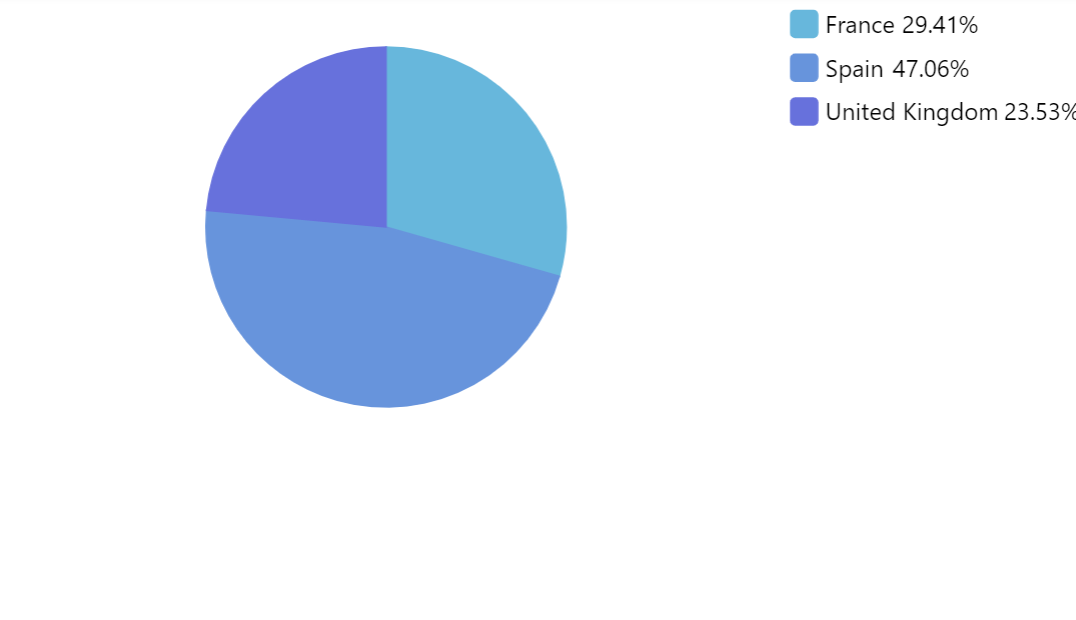
layout: root.horizontalLayout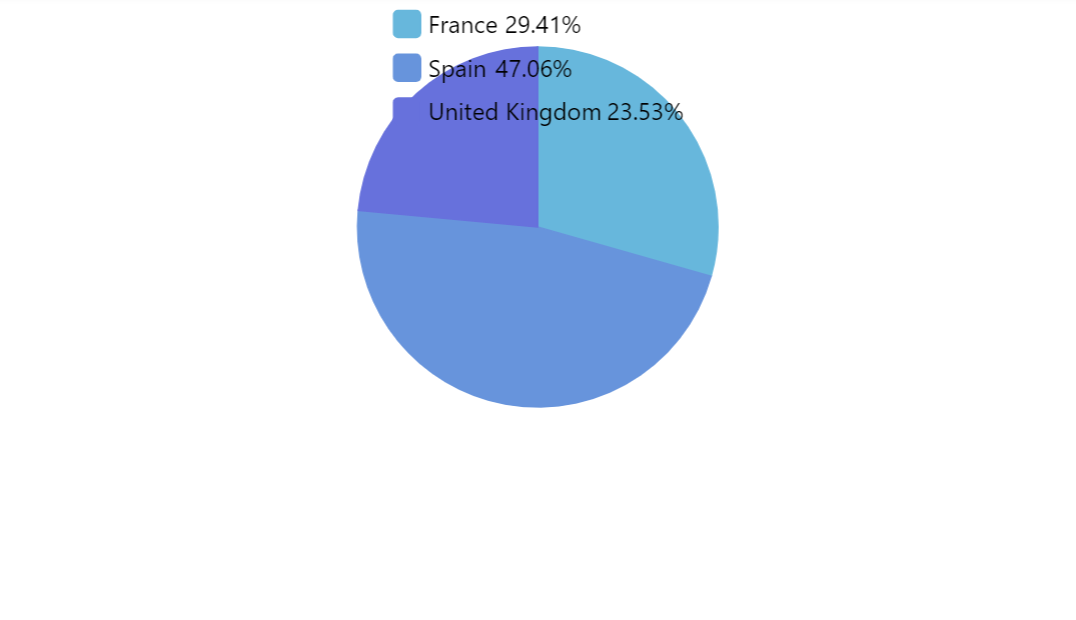
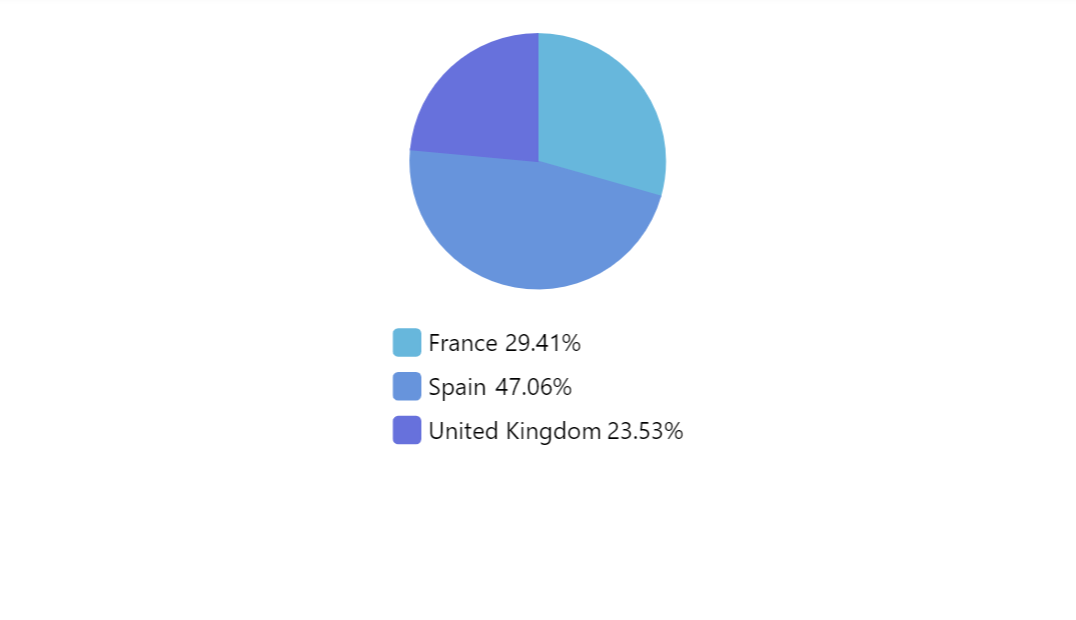
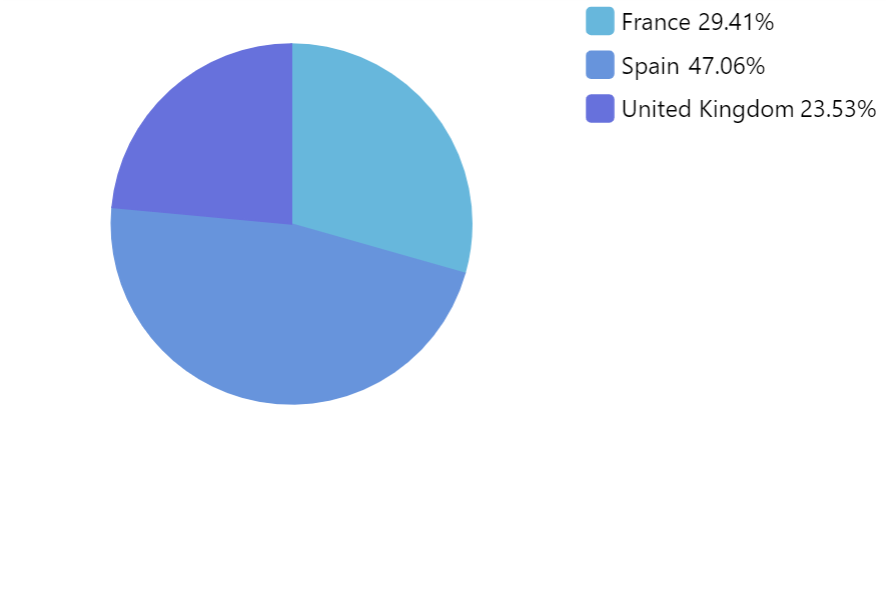
layout not setThe legend appears on the bottom (or right) because it's the last element we've added to the chart.
If we'd like the legend to appear on top (or left), we'd need to ensure it's the first child of the chart by using children.unshift() method instead of push().
let chart = root.container.children.push(
  am5percent.PieChart.new(root, {
    layout: root.verticalLayout
  })
);

let legend = chart.children.unshift(am5.Legend.new(root, {}));
var chart = root.container.children.push(
  am5percent.PieChart.new(root, {
    layout: root.verticalLayout
  })
);

var legend = chart.children.unshift(am5.Legend.new(root, {}));
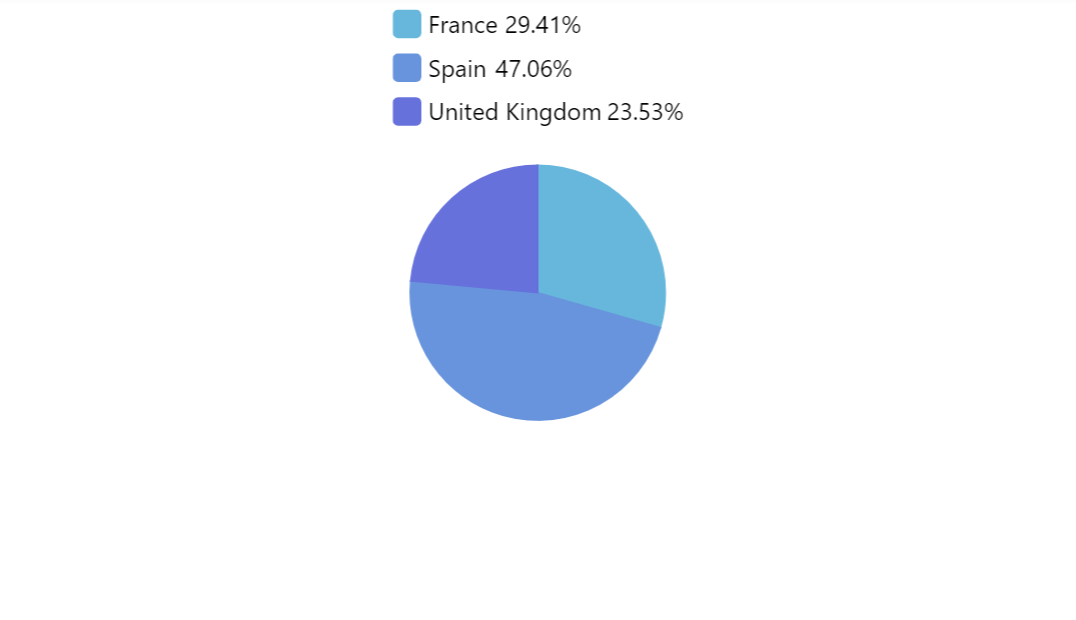
layout: root.verticalLayout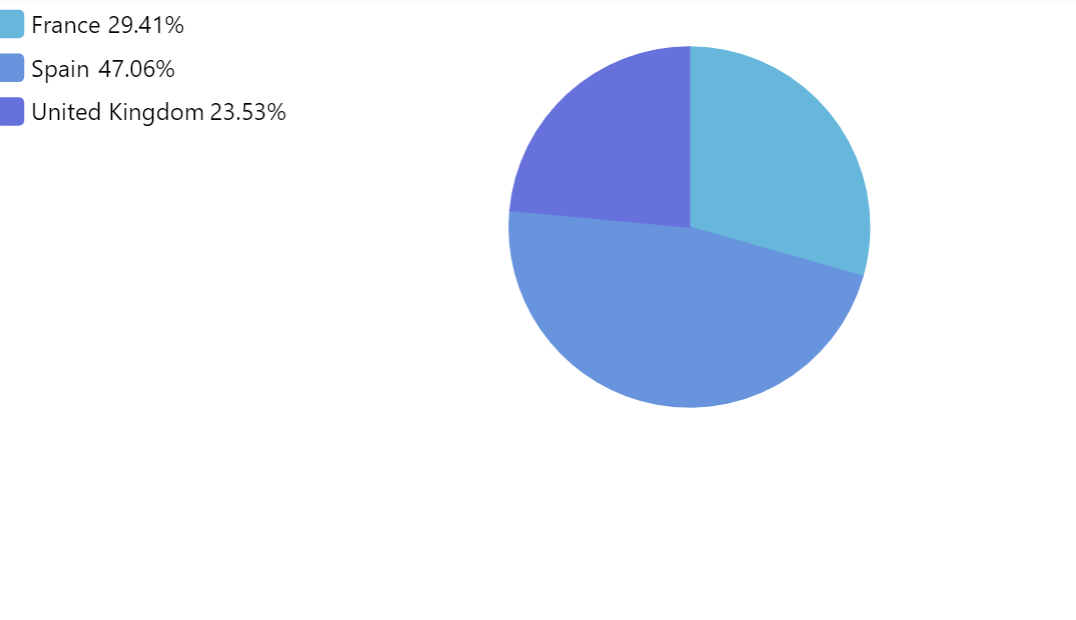
layout: root.horizontalLayoutlayout not setMORE INFO For more information about layouts, visit our "Containers: Layout" tutorial.
Aligning
We can also fine-tune legend's position by specifying x and/or y values as well as using centerX and centerY settings to indicate what should be considered the center of the legend.
The following will align the legend vertically to the middle of the chart:
let legend = chart.children.push(am5.Legend.new(root, {
  y: am5.percent(50),
  centerY: am5.percent(50)
}));
legend = chart.children.push(am5.Legend.new(root, {
  y: am5.percent(50),
  centerY: am5.percent(50)
}));
y: am5.percent(0)centerY: am5.percent(0)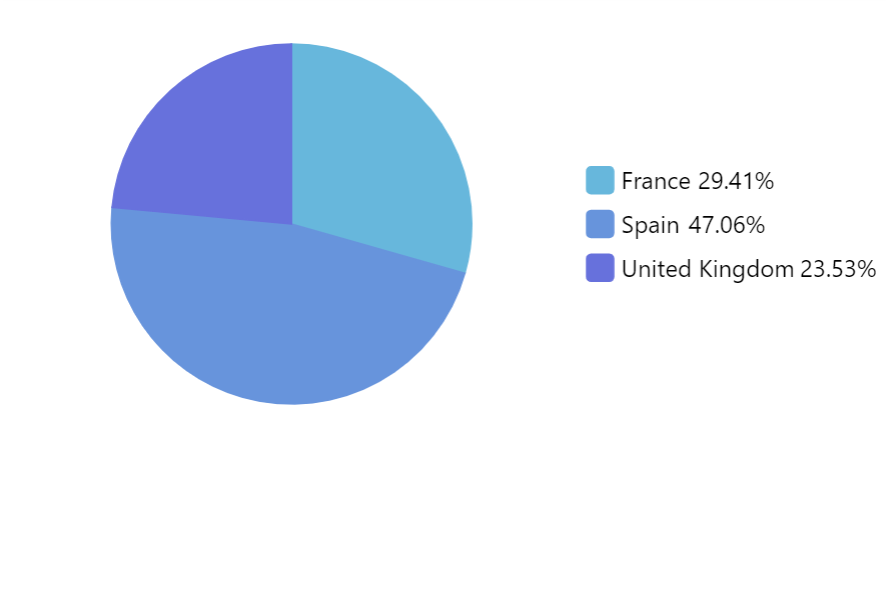
y: am5.percent(50)centerY: am5.percent(50) 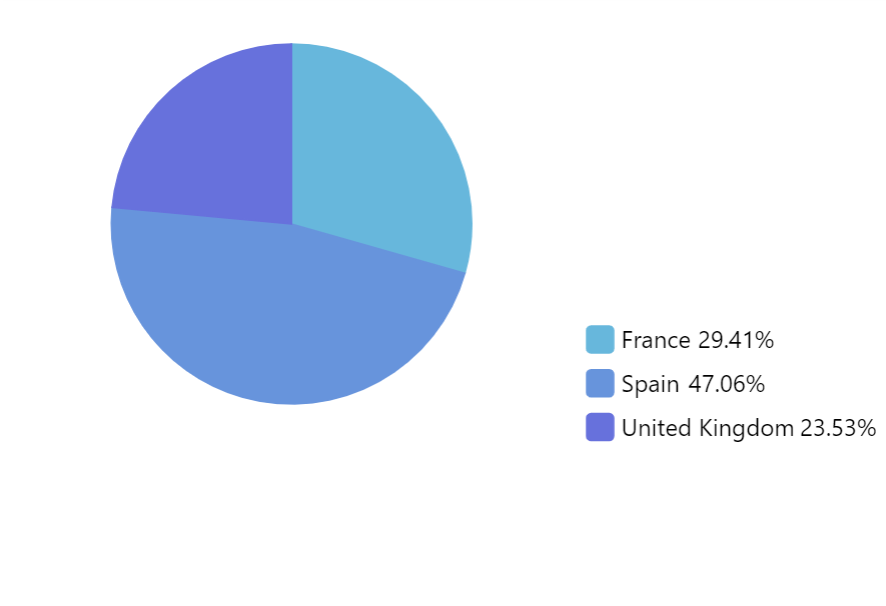
y: am5.percent(100)centerY: am5.percent(100) Layout
Setting layout
Legend's items can be arranged horizontally, vertically, or as a grid (default).
Just like with any container, e.g. chart, it is controlled by the layout setting.
In legend, it's set to root.gridLayout by default, which means that legend items are arranged horizontally in rows, wrapping to new lines when they don't fit, as well as aligned into columns.
let legend = chart.children.push(am5.Legend.new(root, {
  x: am5.percent(50),
  centerX: am5.percent(50),
  layout: root.verticalLayout
}));
legend = chart.children.push(am5.Legend.new(root, {
  x: am5.percent(50),
  centerX: am5.percent(50),
  layout: root.verticalLayout
}));
layout: root.gridLayout (default)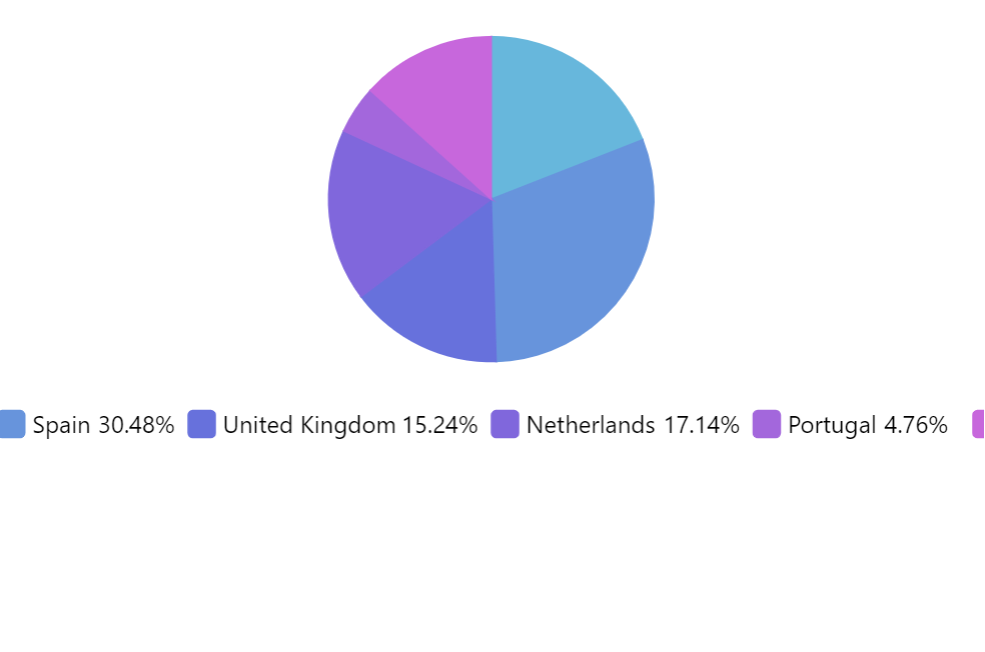
layout: root.horizontalLayout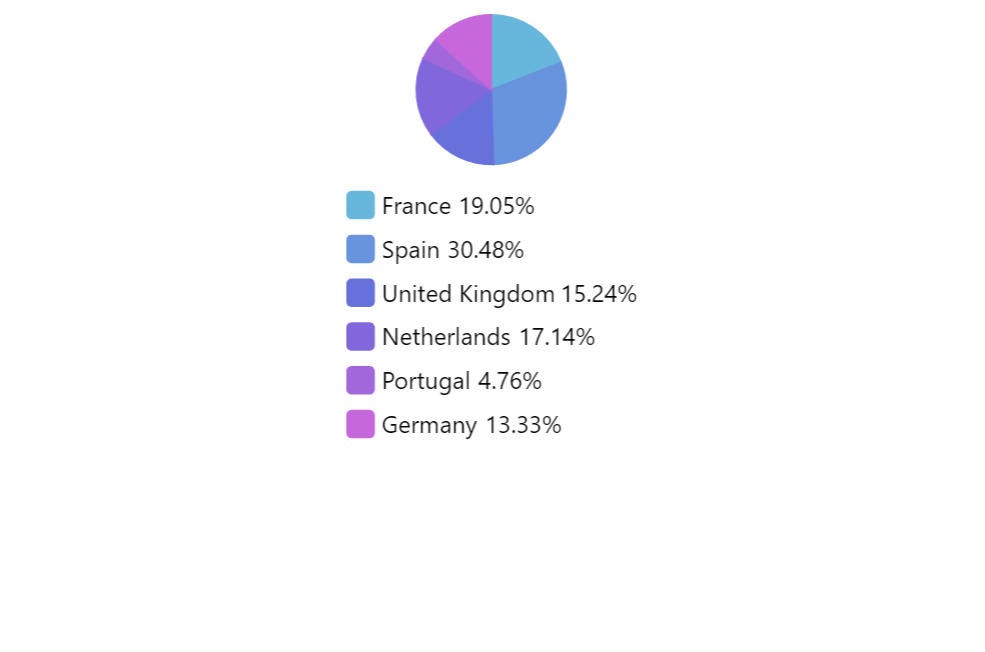
layout: root.verticalLayoutObviously, when choosing layout, we need to think of the place the legend will appear in, as well as a number of potential items in it.
MORE INFO For more information about layouts, visit our "Containers: Layout" tutorial.
Grid layout
Grid layout can also be tweaked with a couple of settings of its own:
maxColumns- maximum number of columns to allow in the grid.fixedWidthGrid- if set totruewill make all columns equal in width, as opposed to best fit.
Since we don't want to modify a global instance of the grid layout (it may be used by other chart elements), we will need to create a unique instance of GridLayout specifically for the legend:
let legend = chart.children.push(am5.Legend.new(root, {
  centerX: am5.percent(50),
  x: am5.percent(50),
  layout: am5.GridLayout.new(root, {
    maxColumns: 3,
    fixedWidthGrid: true
  })
}));
var legend = chart.children.push(am5.Legend.new(root, {
  centerX: am5.percent(50),
  x: am5.percent(50),
  layout: am5.GridLayout.new(root, {
    maxColumns: 3,
    fixedWidthGrid: true
  })
}));
fixedWidthGrid: false (default)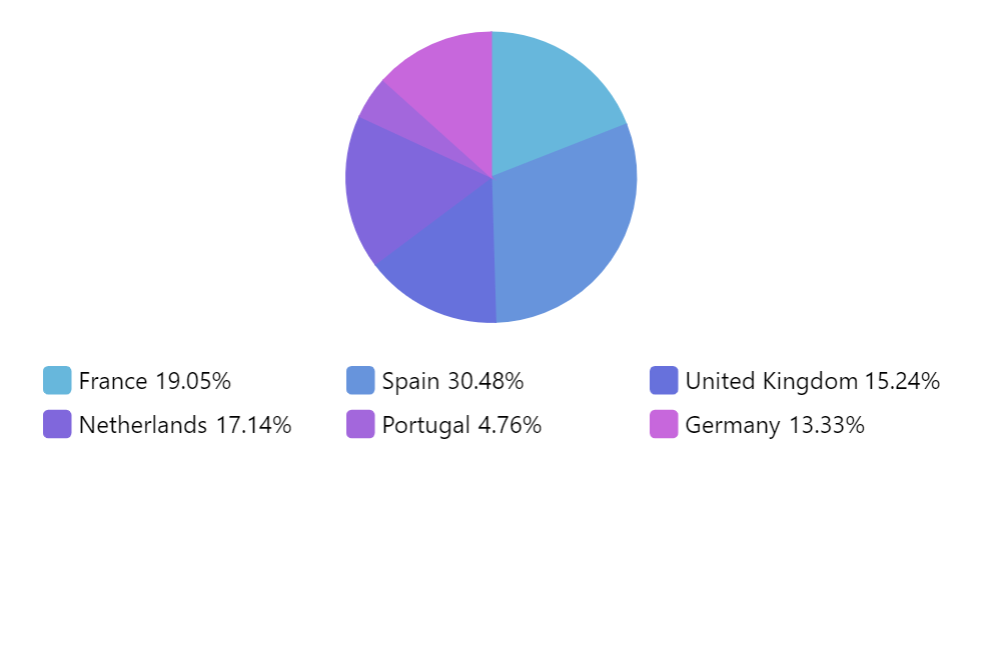
fixedWidthGrid: true
maxColumns: 2See the Pen Pie chart legend alignment by amCharts team (@amcharts) on CodePen.
MORE INFO For more information about grid layout, visit our "Containers: Grid" tutorial.
Markers
There are a few ways a legend can build its markers:
- Markers that resemble actual look of the item, e.g. series.
- Default square markers.
- Completely custom markers.
Marker size
Markers are 18 x18 pixels by default.
We can change that using markers.template:
legend.markers.template.setAll({
  width: 24,
  height: 24
});
legend.markers.template.setAll({
  width: 24,
  height: 24
});
Note that marker template is just a container but not actual element, so there's not much we can do here besides the size, and some other settings like padding.
Look-resembling markers
By default legend will try to build a marker that resembles its items, e.g. series.
For example, marker for line series will look like line with the same color.
Since the markers are build by each target, e.g. series, and can contain a number of elements, there's little we can do about configuring the look for those.
Default markers
If we want to have more control on look of the markers, we can enable default markers by setting legend's setting useDefaultMarker to true.
let legend = chart.children.push(am5.Legend.new(root, {
  centerX: am5.percent(50),
  x: am5.percent(50),
  useDefaultMarker: true
}));
var legend = chart.children.push(am5.Legend.new(root, {
  centerX: am5.percent(50),
  x: am5.percent(50),
  useDefaultMarker: true
}));
Now the legend will create its own markers for each item, using RoundedRectangle elements.
We can configure those rectangles using markerRectangles.template. It accepts all RoundedRectangle settings.
legend.markerRectangles.template.setAll({
  cornerRadiusTL: 10,
  cornerRadiusTR: 10,
  cornerRadiusBL: 10,
  cornerRadiusBR: 10
});
legend.markerRectangles.template.setAll({
  cornerRadiusTL: 10,
  cornerRadiusTR: 10,
  cornerRadiusBL: 10,
  cornerRadiusBR: 10
});
The above will make all legend markers round:
See the Pen Pie chart legend alignment by amCharts team (@amcharts) on CodePen.
NOTE Some series like pie, column, and similar do not have their own custom look of the marker and will use default markers regardless of the useDefaultMarker setting.
Images as markers
Markers can also be completely customized.
After we insert an item into legend's data, it creates a related data item and all the marker elements - such as rectangles.
We can grab that data item, use it to access visual elements, then modify them.
The following code will remove built-in marker elements and will replace them with an image.
let legendDataItem = legend.dataItems[legend.dataItems.length - 1];
let marker = legendDataItem.get("marker")
marker.children.push(am5.Picture.new(root, {
  width: 20,
  height: 20,
  src: "/myImage.svg"
}));
legendDataItem.get("markerRectangle").set("forceHidden", true);
var legendDataItem = legend.dataItems[legend.dataItems.length - 1];
var marker = legendDataItem.get("marker")
marker.children.push(am5.Picture.new(root, {
  width: 20,
  height: 20,
  src: "/myImage.svg"
}));
legendDataItem.get("markerRectangle").set("forceHidden", true);
See the Pen Images as legend markers by amCharts team (@amcharts) on CodePen.
Another way to modify legend markers is to use template's setup function.
Same result, different approach.
legend.markers.template.setup = function(marker) {
  marker.events.on("dataitemchanged", function() {
    let dataItem = marker._dataItem
    let series = dataItem.dataContext;
    marker.children.push(am5.Picture.new(root, {
      width: 20,
      height: 20,
      src: "https://www.amcharts.com/wp-content/uploads/flags/" + series.get("name").toLowerCase() + ".svg"
    }));

    dataItem.on("markerRectangle", function(rectangle) {
      rectangle.set("forceHidden", true);
    })
  });
};
legend.markers.template.setup = function(marker) {
  marker.events.on("dataitemchanged", function() {
    var dataItem = marker._dataItem
    var series = dataItem.dataContext;
    marker.children.push(am5.Picture.new(root, {
      width: 20,
      height: 20,
      src: "https://www.amcharts.com/wp-content/uploads/flags/" + series.get("name").toLowerCase() + ".svg"
    }));

    dataItem.on("markerRectangle", function(rectangle) {
      rectangle.set("forceHidden", true);
    })
  });
};
See the Pen Images as legend markers by amCharts team (@amcharts) on CodePen.
Labels
Configuring labels
Legend has two properties related to labels: labels and valueLabels.
One contains all instances of name labels, the other - value labels.
Both are "list templates", meaning that we can use their template property to specify any setting for those labels.
template accepts any Label setting.
legend.labels.template.setAll({
  fontSize: 16,
  fontWeight: "300"
});


legend.valueLabels.template.setAll({
  fontSize: 16,
  fontWeight: "400"
});
legend.labels.template.setAll({
  fontSize: 16,
  fontWeight: "300"
});


legend.valueLabels.template.setAll({
  fontSize: 16,
  fontWeight: "400"
});
Disabling value labels
Legend comes with both labels and value labels, with space reserved for both of them.
If you are not using the latter, you might consider disabling them, so that the legend becomes more compact, possibly freeing up more space for the chart itself.
legend.valueLabels.template.set("forceHidden", true);
legend.valueLabels.template.set("forceHidden", true);
Dynamic label content
In most charts legend's labels will be populated by its series.
The content of labels will depend on whether legend is displaying list of series, or series data items, and how those series are set up.
For series-specific configuration options refer to these tutorials:
Altering functionality
Disabling toggling
Legend items are togglable by default.
To disable toggling, we need to set legend's clickTarget setting to "none":
let legend = chart.children.push(am5.Legend.new(root, {
  y: am5.percent(50),
  centerY: am5.percent(50),
  clickTarget: "none"
}));
var legend = chart.children.push(am5.Legend.new(root, {
  y: am5.percent(50),
  centerY: am5.percent(50),
  clickTarget: "none"
}));
See the Pen amCharts 5: Spectrum chart by amCharts team (@amcharts) on CodePen.
Disabling hovers
To disable just hover effects, like when hovering on legend item triggers hover on a related object, like a slice of a pie chart, we will need to explicitly disable pointerover event of all created items.
legend.itemContainers.template.setup = function(item) {
  item.events.disableType("pointerover")
};
legend.itemContainers.template.setup = function(item) {
  item.events.disableType("pointerover")
};
See the Pen Disabling hovers in PieChart legend by amCharts team (@amcharts) on CodePen.
Disabling graying out
To disable graying out of legend items when they are toggled off, simply disable propagation of a disabled state on item containers:
legend.itemContainers.template.set("setStateOnChildren", false);
legend.itemContainers.template.set("setStateOnChildren", false);
Scrollable legend
If legend's contents do not fit into its height, we can enable scrolling by setting its verticalScrollbar instance of a Scrollbar:
var legend = chart.children.push(am5.Legend.new(root, {
  centerY: am5.percent(50),
  y: am5.percent(50),
  layout: root.verticalLayout,
  height: am5.percent(100),
  verticalScrollbar: am5.Scrollbar.new(root, {
    orientation: "vertical"
  })
}));
var legend = chart.children.push(am5.Legend.new(root, {
  centerY: am5.percent(50),
  y: am5.percent(50),
  layout: root.verticalLayout,
  height: am5.percent(100),
  verticalScrollbar: am5.Scrollbar.new(root, {
    orientation: "vertical"
  })
}));
NOTE Please note that height needs to be set for this to work properly.
See the Pen Pie chart legend alignment by amCharts team (@amcharts) on CodePen.
External container
Separate Root element
Creating a legend in an external container is as easy as creating another root element, then pushing legend into its children:
let legendRoot = am5.Root.new("legenddiv");

let legend = legendRoot.container.children.push(
  am5.Legend.new(legendRoot, {
    width: am5.percent(100),
    centerX: am5.percent(50),
    x: am5.percent(50),
    layout: legendRoot.grid
  })
);

legend.data.setAll(series.dataItems);
var legendRoot = am5.Root.new("legenddiv");

var legend = legendRoot.container.children.push(
  am5.Legend.new(legendRoot, {
    width: am5.percent(100),
    centerX: am5.percent(50),
    x: am5.percent(50),
    layout: legendRoot.grid
  })
);

legend.data.setAll(series.dataItems);
See the Pen Pie chart with scrollable legend by amCharts team (@amcharts) on CodePen.
NOTEFor information on how to include external legend when exporting chart to an image, refer to "Exporting to image formats: Combining multiple images" tutorial.
External legend on XY charts
NOTEIf you are using external legend on an XY chart, make sure you apply XY default theme to the legend's root element as well as use proper root element reference for XY series bullets.
let legendRoot = am5.Root.new("legenddiv");

legendRoot.setThemes([
  am5themes_Animated.new(legendRoot),
  am5xy.DefaultTheme.new(legendRoot)
]);
var legendRoot = am5.Root.new("legenddiv");

legendRoot.setThemes([
  am5themes_Animated.new(legendRoot),
  am5xy.DefaultTheme.new(legendRoot)
]);
Sizing external legend container
If we'd like our external legend to auto-size according to its actual contents, we could use its boundschanged event:
legend.events.on("boundschanged", function() {
  document.getElementById("legenddiv").style.height = legend.height() + "px"
});
legend.events.on("boundschanged", function() {
  document.getElementById("legenddiv").style.height = legend.height() + "px"
});
See the Pen Pie chart with external legend by amCharts team (@amcharts) on CodePen.
And here's another example which creates a horizontally-scrollable external legend:
See the Pen Pie chart with external horizontally-scrollable legend by amCharts team (@amcharts) on CodePen.
Related tutorials
- Right-to-left legend
- Adding check marks to legend markers
- Auto-wrapping legend labels
- Individual legend item for each column in series
- Grouping legend items
- Dynamically changing legend position
- Aligning a legend with plot container
- Pie chart with right-aligned labels
- Toggling all series but one using legend
- Toggle multiple pie slices via legend
- Using series color for legend labels
- Applying custom hover/active states on legend markers