Hierarchy charts (Treemap, Sunburst, Force-directed tree, etc.) are used to display multi-level data, in a branching parent-child tree.
Loading required modules
Everything required to create hierarchy charts are two amCharts 5 modules: "index" and "hierarchy".
You can import those in your TypeScript / ES6 application as JavaScript modules:
import * as am5 from "@amcharts/amcharts5";
import * as am5hierarchy from "@amcharts/amcharts5/hierarchy";
For vanilla JavaScript applications and web pages, you can use "script" version:
<script src="https://cdn.amcharts.com/lib/5/index.js"></script>
<script src="https://cdn.amcharts.com/lib/5/hierarchy.js"></script>
MORE INFO For more information on installing amCharts 5 as well as loading modules refer to our "Getting started" tutorial.
Series
Hierarchy charts are chart-less. This means that rather than creating a chart element, we add series directly to the root container.
Adding
There are following types of series supported in hierarchy charts:
| Class | Example | |
|---|---|---|
ForceDirected |  | More info |
Pack | 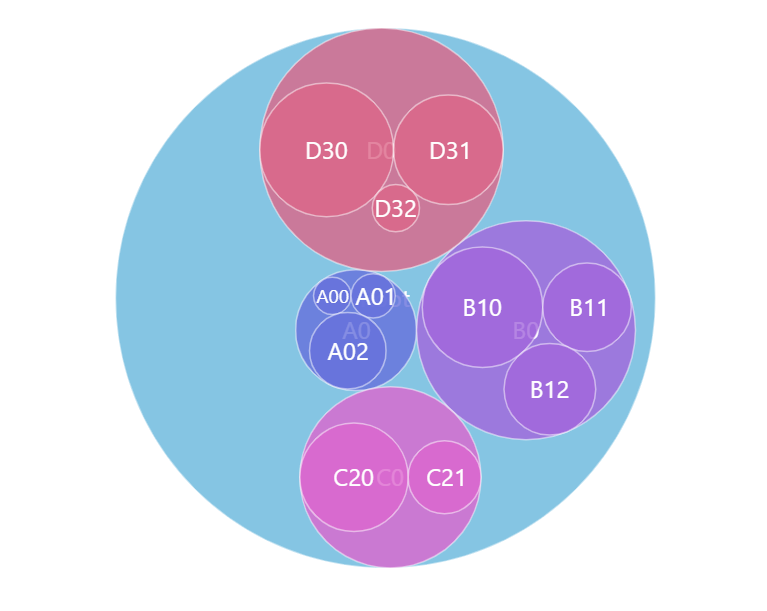 | More info |
Partition | 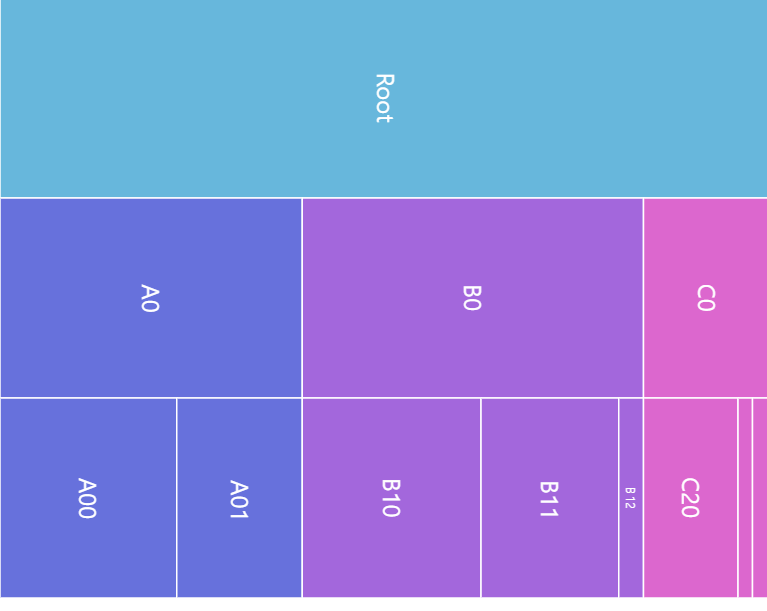 | More info |
Sunburst | 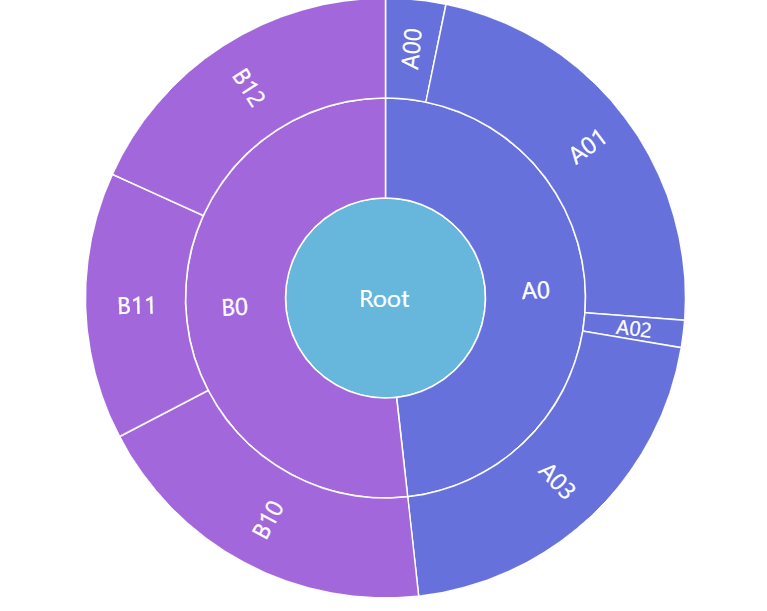 | More info |
Tree | 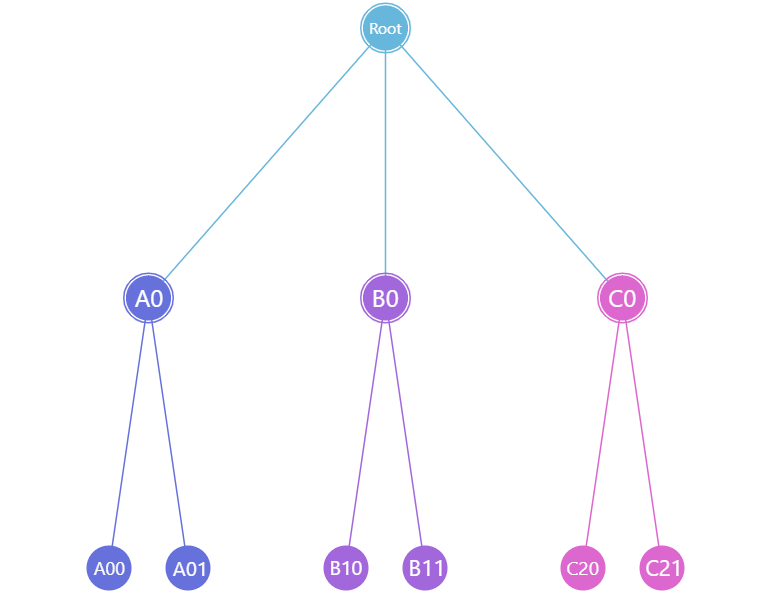 | More info |
Treemap | 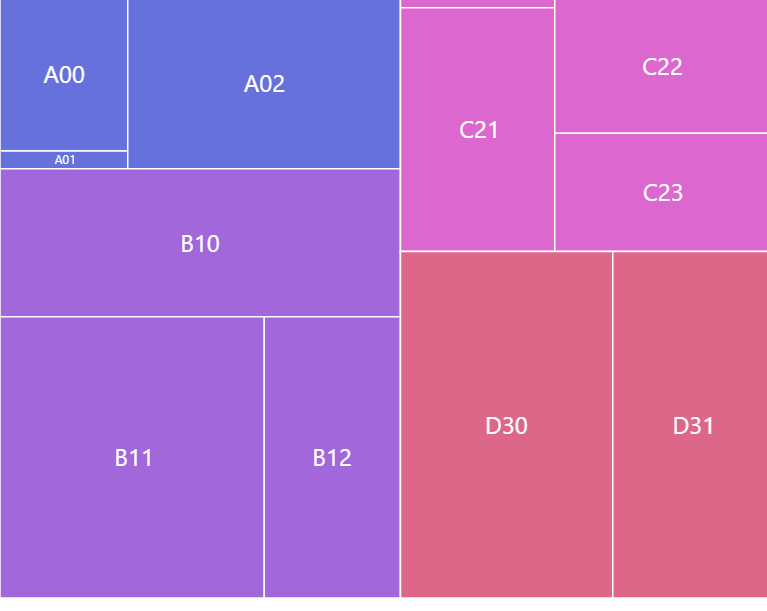 | More info |
VoronoiTreemap | 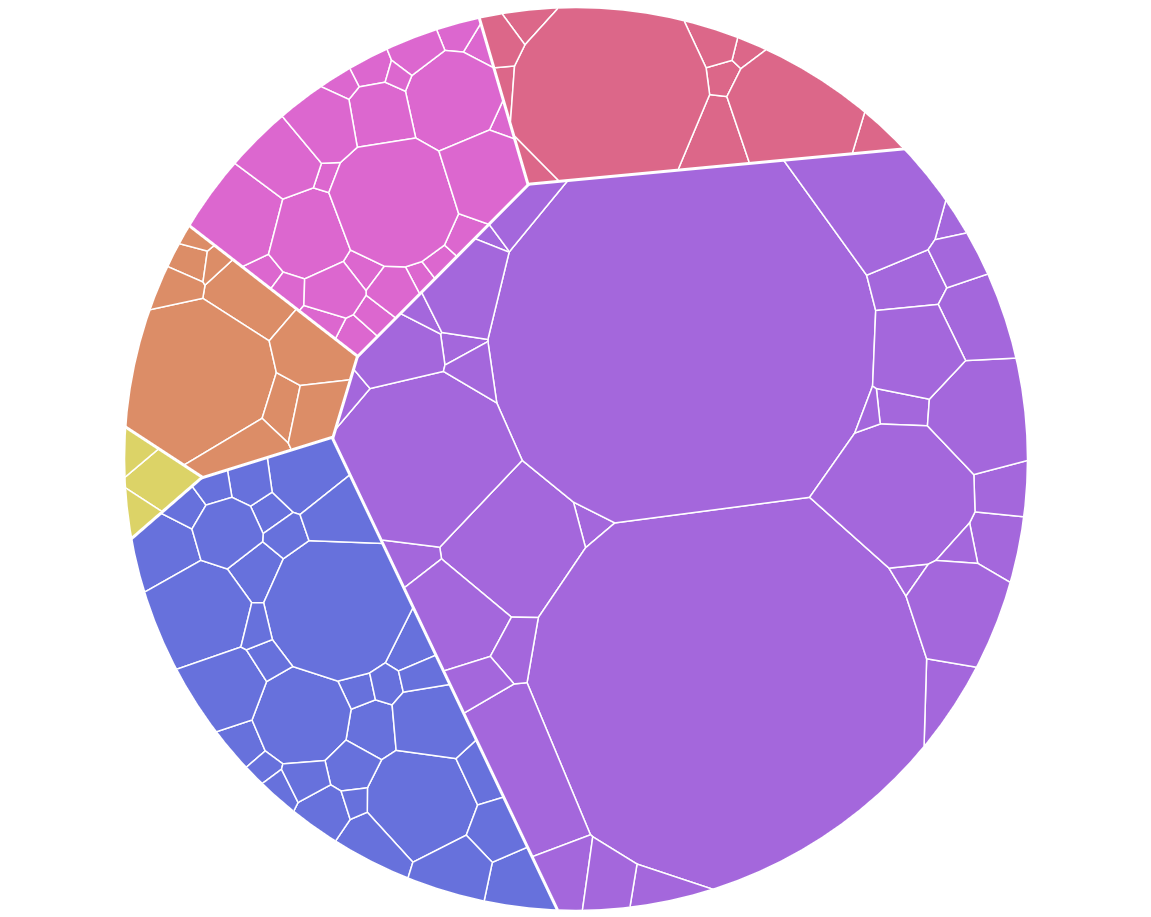 | More info |
Like everywhere else, we use its new() method to instantiate series, then push it into series list of the chart:
let series = root.container.children.push(
  am5hierarchy.Treemap.new(root, {
    valueField: "value",
    categoryField: "name",
    childDataField: "children"
  })
);
var series = root.container.children.push(
  am5hierarchy.Treemap.new(root, {
    valueField: "value",
    categoryField: "name",
    childDataField: "children"
  })
);
Data fields
Most hierarchy charts require three data fields:
- Category: a field in data that holds a string-based identifier, like a name.
- Children: a field in data that holds array of data objects for child nodes.
- Value of the node: a field in data that holds numeric value of the node.
Data fields basically mean which keys in data objects to look for specific value.
They can be set via series' settings categoryField, childDataField, and valueField.
Let's take sample data:
[{
  name: "Root",
  children: [{
    name: "A0",
    children: [{
      name: "A00",
      value: 71
    }, {
      name: "A01",
      value: 33
    }, {
      name: "A02",
      value: 2
    }]
  }, {
    name: "B0",
    children: [{
      name: "B10",
      value: 78
    }, {
      name: "B11",
      value: 36
    }]
  }, {
    name: "C0",
    children: [{
      name: "C20",
      value: 46
    }, {
      name: "C21",
      value: 28
    }, {
      name: "C22",
      value: 18
    }]
  }]
}]
The following data fields would need to describe data fields like this:
let series = root.container.children.push(
  am5hierarchy.Treemap.new(root, {
    valueField: "value",
    categoryField: "name",
    childDataField: "children"
  })
);
var series = root.container.children.push(
  am5hierarchy.Treemap.new(root, {
    valueField: "value",
    categoryField: "name",
    childDataField: "children"
  })
);
Optional data fields
Besides the three required data fields, hierarchy charts can also have a number of other data fields, that can be used to control initial state of the nodes (disabledField) or their color (colorField).
The following code show how we can use disabledField to pre-collapse individual nodes.
Here's the data"
[{
  name: "Root",
  children: [{
    name: "A0",
    collapsed: true,
    children: [{
      name: "A00",
      value: 71
    }, {
      name: "A01",
      value: 33
    }, {
      name: "A02",
      value: 2
    }]
  }, {
    name: "B0",
    children: [{
      name: "B10",
      value: 78
    }, {
      name: "B11",
      value: 36
    }]
  }, {
    name: "C0",
    collapsed: true,
    children: [{
      name: "C20",
      value: 46
    }, {
      name: "C21",
      value: 28
    }, {
      name: "C22",
      value: 18
    }]
  }]
}]
And he code:
let series = root.container.children.push(
  am5hierarchy.Treemap.new(root, {
    valueField: "value",
    categoryField: "name",
    childDataField: "children",
    disabledField: "collapsed"
  })
);
var series = root.container.children.push(
  am5hierarchy.Treemap.new(root, {
    valueField: "value",
    categoryField: "name",
    childDataField: "children",
    disabledField: "collapsed"
  })
);
The above will make the chart start with "A0" and "C0" nodes collapsed, while "B0" expanded.
Data structure
IMORTANT A data for all hierarchy charts requires to have just one top item. Having several items on top level might break the chart. If we don't want this top item to appear on the chart itself, we can hide it by providing topLevel: 1 in series settings. Refer to "Tree depth" section of this tutorial for more info.
Setting data
In all hierarchy charts, each entry in data represents a node. If it has data for children (as identified by childDataField), it also may have child nodes, which in turn can have their own children, etc.
Node can also have a value, which in most hierarchy charts will determine its size.
Basically, if node has value in its data, this value will be used. If node does not have value set in data, but has children, than its value will be the sum of all child values.
The data is set directly on series via its data property:
series.data.setAll([{
  name: "Root",
  children: [{
    name: "A0",
    children: [{
      name: "A00",
      value: 71
    }, {
      name: "A01",
      value: 33
    }, {
      name: "A02",
      value: 2
    }]
  }, {
    name: "B0",
    children: [{
      name: "B10",
      value: 78
    }, {
      name: "B11",
      value: 36
    }]
  }, {
    name: "C0",
    children: [{
      name: "C20",
      value: 46
    }, {
      name: "C21",
      value: 28
    }, {
      name: "C22",
      value: 18
    }]
  }]
}]);
IMPORTANT It's a good practice to make sure that setting data happens as late into code as possible. Once you set data, all related objects are created, so any configuration settings applied afterwards might not carry over.
MORE INFO There are more ways to set, update, add, or load data. For more information please refer to our dedicated "Data" tutorial.
Flat data
Hierarchy charts can handle "flat data" — data items in a single array that define their parent-child relations via IDs rather than children.
There are two elements to using flat data:
parentIdFieldneeds to be specified, so that Hierarchy knows which field to use in looking up for a parent ID.- Instead of
series.data.setAll(), we need to useseries.setFlatData().
let tree = root.container.children.push(am5hierarchy.Tree.new(root, {
  valueField: "value",
  categoryField: "name",
  childDataField: "children",
  idField: "id",
  parentIdField: "parentId"
}));

tree.setFlatData([
  { id: "root", name: "Root", value: 100 },
  { id: "a",    name: "A",    value: 50,  parentId: "root" },
  { id: "a1",   name: "A1",   value: 20,  parentId: "a" },
  { id: "b",    name: "B",    value: 30,  parentId: "root" }
]);
var tree = root.container.children.push(am5hierarchy.Tree.new(root, {
  valueField: "value",
  categoryField: "name",
  childDataField: "children",
  idField: "id",
  parentIdField: "parentId"
}));

tree.setFlatData([
  { id: "root", name: "Root", value: 100 },
  { id: "a",    name: "A",    value: 50,  parentId: "root" },
  { id: "a1",   name: "A1",   value: 20,  parentId: "a" },
  { id: "b",    name: "B",    value: 30,  parentId: "root" }
]);
Pre-selected branch
In order for our chart to function properly, we need to tell series which node is currently selected.
It ensures that:
- Current active node is correctly set.
- Initial chart tree depths are respected.
We do that by setting series selectedDataItem. Please note that this is a data item, not a node itself.
For the most uses, this will be the root data item, which will always come first in series' dataItems list:
series.set("selectedDataItem", series.dataItems[0]);
series.set("selectedDataItem", series.dataItems[0]);
IMPORTANT The selectedDataItem needs to be set after data is set to the series.
For more information about configuring appearance of the flow series, refer to respective tutorials:
- Configuring Force-directed series.
- Configuring Pack series.
- Configuring Partition.
- Configuring Sunburst.
- Configuring Tree.
- Configuring Treemap.
Node value
Each node in a hierarchy has its value, which mainly affects its size.
Value of a node is calculated this way:
- Value is retrieved from data via
valueFielddata field if present. - If value is not present in data, but node has children, its value will be the sum of values of all its children.
To paraphrase the above, there are two "correct" ways to set values in hierarchy data:
- Set values only on "end" nodes (nodes that do not have children).
- Set value for all nodes, including the top node.
Node colors
There is a number of ways we can specify all colors for hierarchy nodes.
For information on how to do that, refer to "Hierarchy node colors" tutorial.
Tooltips
Nodes are pre-set to display a tooltip on hover containing name of the category and its value.
We can modify contents of the tooltips using tooltipText on node's template:
series.nodes.template.set("tooltipText", "{category}: [bold]{sum}[/]");
series.nodes.template.set("tooltipText", "{category}: [bold]{sum}[/]");
Contents of the tooltip can include data placeholders (codes in curly brackets that will be replaced by actual data) and in-line formatting blocks (formatting instructions enclosed in square brackets).
Refer to IHierarchyDataItem for available keys for the data placeholders.
Tree depth
There are two hierarchy settings that control depth of the tree: initialDepth and topDepth.
initialDepth specifies how mane levels to show initially, when the chart loads.
It will also be used when resetting the chart to the top level.
topDepth indicates the level, which should be considered top level. Any level in data above that will be ignored and not shown on the chart.
let series = root.container.children.push(
  am5hierarchy.Treemap.new(root, {
    valueField: "value",
    categoryField: "name",
    childDataField: "children",
    initialDepth: 2,
    topDepth: 1
  })
);
var series = root.container.children.push(
  am5hierarchy.Treemap.new(root, {
    valueField: "value",
    categoryField: "name",
    childDataField: "children",
    initialDepth: 2,
    topDepth: 1
  })
);

topDepth: 0initialDepth: 1 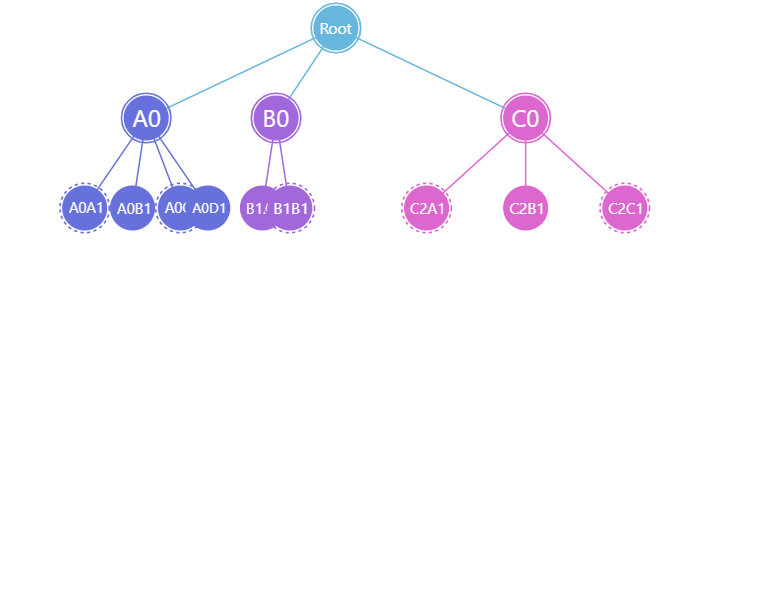
topDepth: 0initialDepth: 2 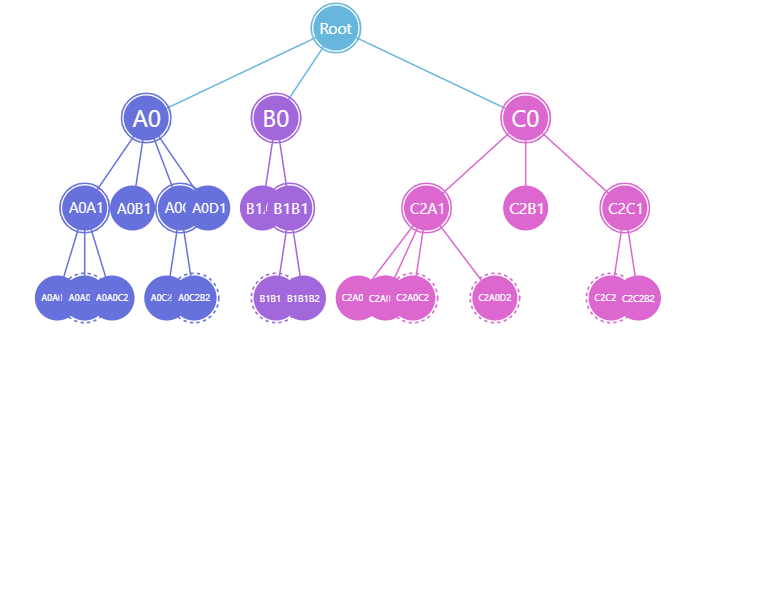
topDepth: 0initialDepth: 3 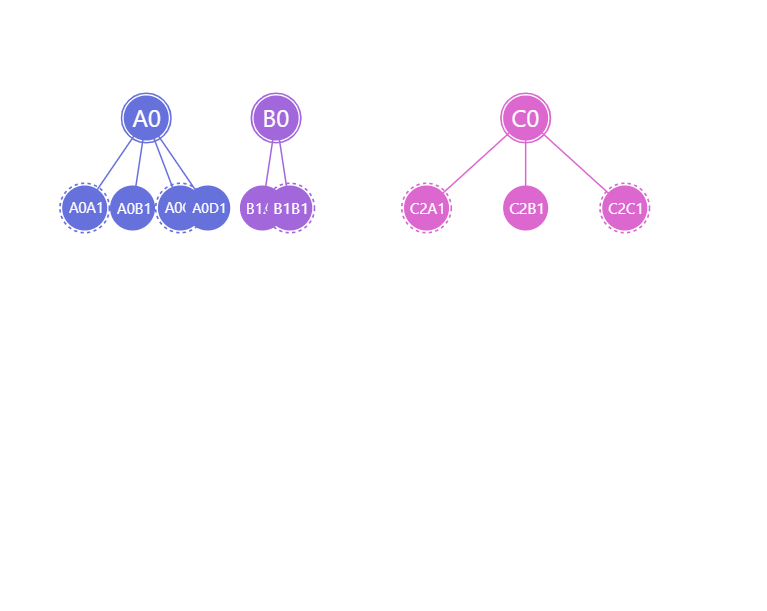
topDepth: 1initialDepth: 1NOTE In hierarchy charts that size their nodes relatively, like a force-directed, top node will affect the size of other nodes even if it is hidden using topDepth is set to 1 (hiding top node). To work around it, simply set value for the top node to zero.
Drill-down
Hierarchy nodes that have children are clickable.
Depending on series type and settings, certain drill-down actions happen, like zooming in on the node, exploding a children tree, etc.
For more information about this, please refer to "Hierarchy drill-down" tutorial.
Additional controls
Hierarchy is a "container-less" chart. This means that there's no wrapper "chart" element, that can be used to add series and external controls to.
If we don't need anything else besides series, we can add it directly to the container of the root element.
However, if we need to add other elements, we'll need to first create a "wrapper (or main) container", we'll be using add all the stuff to:
let container = root.container.children.push(am5.Container.new(root, {
  width: am5.percent(100),
  height: am5.percent(100),
  layout: root.verticalLayout
}));
var container = root.container.children.push(am5.Container.new(root, {
  width: am5.percent(100),
  height: am5.percent(100),
  layout: root.verticalLayout
}));
NOTEThe layout setting of the wrapper container will determine how chart elements are laid out. For more information, refer to "Containers: Layout".
Chart title
Chart title can be added as a Label element child to the wrapper container:
var title = container.children.push(am5.Label.new(root, {
  text: "Network Schema",
  fontSize: 20,
  x: am5.percent(50),
  centerX: am5.percent(50)
}));
var title = container.children.push(am5.Label.new(root, {
  text: "Network Schema",
  fontSize: 20,
  x: am5.percent(50),
  centerX: am5.percent(50)
}));
Breadcrumb navigation
All hierarchy charts support breadcrumb control, which will show current drill-down path, as well as allow jumping to specific level/node in the path.
We can add as wrapper container's child:
container.children.unshift(
  am5hierarchy.BreadcrumbBar.new(root, {
    series: series
  })
);
container.children.unshift(
  am5hierarchy.BreadcrumbBar.new(root, {
    series: series
  })
);
For more information on how to use breadcrumb control, refer to "Breadcrumb navigation" tutorial.
Legend
To add a legend, we simply need to create an instance of a Legend class (which is a part of "core" package), push it to wrapper container's children (or any other place we want it to be), as well as set its data (in case of hierarchy chart, we will probably want to have series data items in legend).
Since legend needs to have a data, and hierarchy charts have multi-level nested data items, we will need to specify what exactly we want in the legend.
In most cases it will be the first level data items (ones directly below the root):
let legend = container.children.push(am5.Legend.new(root, {
  centerX: am5.percent(50),
  x: am5.percent(50),
  layout: root.horizontalLayout
}));

legend.data.setAll(series.dataItems[0].get("children"));
var legend = container.children.push(am5.Legend.new(root, {
  centerX: am5.percent(50),
  x: am5.percent(50),
  layout: root.horizontalLayout
}));

legend.data.setAll(series.dataItems[0].get("children"));
MORE INFO For more information on how to configure the legend, set its contents, and other tricks, please visit our dedicated "Legend" tutorial.
See the Pen Force-directed chart with fixed nodes by amCharts team (@amcharts) on CodePen.
Complete example
import * as am5 from "@amcharts/amcharts5";
import * as am5hierarchy from "@amcharts/amcharts5/hierarchy";

// Create root and main container
let root = am5.Root.new("chartdiv");

root.setThemes([
  am5themes_Animated.new(root)
]);

let container = root.container.children.push(
  am5.Container.new(root, {
    width: am5.percent(100),
    height: am5.percent(100),
    layout: root.verticalLayout
  })
);

// Create series and set data
let series = container.children.push(
  am5hierarchy.Treemap.new(root, {
    valueField: "value",
    categoryField: "name",
    childDataField: "children",
    initialDepth: 2
  })
);

series.data.setAll([{
  name: "Root",
  children: [{
    name: "A0",
    children: [{
      name: "A0A1",
      children: [{
        name: "A0A0A2",
        value: 71
      }, {
        name: "A0A0B2",
        children: [{
          name: "A0A0B1A3",
          value: 69
        }, {
          name: "A0A0B1B3",
          value: 85
        }]
      }, {
        name: "A0A0C2",
        value: 48
      }]
    }, {
      name: "A0B1",
      value: 27
    }, {
      name: "A0C1",
      children: [{
        name: "A0C2A2",
        value: 2
      }, {
        name: "A0C2B2",
        children: [{
          name: "A0C2B1A3",
          value: 54
        }, {
          name: "A0C2B1B3",
          value: 16
        }]
      }]
    }, {
      name: "A0D1",
      value: 89
    }]
  }, {
    name: "B0",
    children: [{
      name: "B1A1",
      value: 9
    }, {
      name: "B1B1",
      children: [{
        name: "B1B1A2",
        children: [{
          name: "B1B1A0A3",
          value: 35
        }, {
          name: "B1B1A0B3",
          value: 40
        }]
      }, {
        name: "B1B1B2",
        value: 55
      }]
    }]
  }, {
    name: "C0",
    children: [{
      name: "C2A1",
      children: [{
        name: "C2A0A2",
        value: 24
      }, {
        name: "C2A0B2",
        value: 89
      }, {
        name: "C2A0C2",
        children: [{
          name: "C2A0C2A3",
          children: [{
            name: "C2A0C2A0A4",
            children: [{
              name: "C2A0C2A0A00",
              value: 90
            }, {
              name: "C2A0C2A0A01",
              value: 70
            }, {
              name: "C2A0C2A0A02",
              value: 66
            }, {
              name: "C2A0C2A0A03",
              value: 58
            }]
          }, {
            name: "C2A0C2A0B4",
            children: [{
              name: "C2A0C2A0B10",
              value: 80
            }, {
              name: "C2A0C2A0B11",
              value: 40
            }]
          }]
        }, {
          name: "C2A0C2B3",
          value: 44
        }]
      }, {
        name: "C2A0D2",
        children: [{
          name: "C2A0D3A3",
          value: 28
        }, {
          name: "C2A0D3B3",
          value: 14
        }]
      }]
    }, {
      name: "C2B1",
      value: 40
    }, {
      name: "C2C1",
      children: [{
        name: "C2C2A2",
        children: [{
          name: "C2C2A0A3",
          value: 28
        }, {
          name: "C2C2A0B3",
          children: [{
            name: "C2C2A0B1A4",
            value: 19
          }, {
            name: "C2C2A0B1B4",
            children: [{
              name: "C2C2A0B1B10",
              value: 11
            }, {
              name: "C2C2A0B1B11",
              value: 10
            }, {
              name: "C2C2A0B1B12",
              value: 97
            }, {
              name: "C2C2A0B1B13",
              value: 47
            }]
          }, {
            name: "C2C2A0B1C4",
            children: [{
              name: "C2C2A0B1C20",
              value: 40
            }, {
              name: "C2C2A0B1C21",
              value: 37
            }, {
              name: "C2C2A0B1C22",
              value: 53
            }]
          }]
        }, {
          name: "C2C2A0C3",
          value: 96
        }]
      }, {
        name: "C2C2B2",
        value: 66
      }]
    }]
  }]
}]);
series.set("selectedDataItem", series.dataItems[0]);

// Add breadcrumbs
container.children.unshift(
  am5hierarchy.BreadcrumbBar.new(root, {
    series: series
  })
);
<script src="https://cdn.amcharts.com/lib/5/index.js"></script>
<script src="https://cdn.amcharts.com/lib/5/hierarchy.js"></script>

<div id="chartdiv"></div>

<script>
// Create root and main container
var root = am5.Root.new("chartdiv");

root.setThemes([
  am5themes_Animated.new(root)
]);

var container = root.container.children.push(
  am5.Container.new(root, {
    width: am5.percent(100),
    height: am5.percent(100),
    layout: root.verticalLayout
  })
);

// Create series and set data
var series = container.children.push(
  am5hierarchy.Treemap.new(root, {
    valueField: "value",
    categoryField: "name",
    childDataField: "children",
    initialDepth: 2
  })
);

series.data.setAll([{
  name: "Root",
  children: [{
    name: "A0",
    children: [{
      name: "A0A1",
      children: [{
        name: "A0A0A2",
        value: 71
      }, {
        name: "A0A0B2",
        children: [{
          name: "A0A0B1A3",
          value: 69
        }, {
          name: "A0A0B1B3",
          value: 85
        }]
      }, {
        name: "A0A0C2",
        value: 48
      }]
    }, {
      name: "A0B1",
      value: 27
    }, {
      name: "A0C1",
      children: [{
        name: "A0C2A2",
        value: 2
      }, {
        name: "A0C2B2",
        children: [{
          name: "A0C2B1A3",
          value: 54
        }, {
          name: "A0C2B1B3",
          value: 16
        }]
      }]
    }, {
      name: "A0D1",
      value: 89
    }]
  }, {
    name: "B0",
    children: [{
      name: "B1A1",
      value: 9
    }, {
      name: "B1B1",
      children: [{
        name: "B1B1A2",
        children: [{
          name: "B1B1A0A3",
          value: 35
        }, {
          name: "B1B1A0B3",
          value: 40
        }]
      }, {
        name: "B1B1B2",
        value: 55
      }]
    }]
  }, {
    name: "C0",
    children: [{
      name: "C2A1",
      children: [{
        name: "C2A0A2",
        value: 24
      }, {
        name: "C2A0B2",
        value: 89
      }, {
        name: "C2A0C2",
        children: [{
          name: "C2A0C2A3",
          children: [{
            name: "C2A0C2A0A4",
            children: [{
              name: "C2A0C2A0A00",
              value: 90
            }, {
              name: "C2A0C2A0A01",
              value: 70
            }, {
              name: "C2A0C2A0A02",
              value: 66
            }, {
              name: "C2A0C2A0A03",
              value: 58
            }]
          }, {
            name: "C2A0C2A0B4",
            children: [{
              name: "C2A0C2A0B10",
              value: 80
            }, {
              name: "C2A0C2A0B11",
              value: 40
            }]
          }]
        }, {
          name: "C2A0C2B3",
          value: 44
        }]
      }, {
        name: "C2A0D2",
        children: [{
          name: "C2A0D3A3",
          value: 28
        }, {
          name: "C2A0D3B3",
          value: 14
        }]
      }]
    }, {
      name: "C2B1",
      value: 40
    }, {
      name: "C2C1",
      children: [{
        name: "C2C2A2",
        children: [{
          name: "C2C2A0A3",
          value: 28
        }, {
          name: "C2C2A0B3",
          children: [{
            name: "C2C2A0B1A4",
            value: 19
          }, {
            name: "C2C2A0B1B4",
            children: [{
              name: "C2C2A0B1B10",
              value: 11
            }, {
              name: "C2C2A0B1B11",
              value: 10
            }, {
              name: "C2C2A0B1B12",
              value: 97
            }, {
              name: "C2C2A0B1B13",
              value: 47
            }]
          }, {
            name: "C2C2A0B1C4",
            children: [{
              name: "C2C2A0B1C20",
              value: 40
            }, {
              name: "C2C2A0B1C21",
              value: 37
            }, {
              name: "C2C2A0B1C22",
              value: 53
            }]
          }]
        }, {
          name: "C2C2A0C3",
          value: 96
        }]
      }, {
        name: "C2C2B2",
        value: 66
      }]
    }]
  }]
}]);
series.set("selectedDataItem", series.dataItems[0]);

// Add breadcrumbs
container.children.unshift(
  am5hierarchy.BreadcrumbBar.new(root, {
    series: series
  })
);
</script>
See the Pen Treemap chart by amCharts team (@amcharts) on CodePen.