This tutorial will address how to build gauges using radar chart components.
Creating chart
In amCharts 5, we use radar chart to create gauges.
That means that the process of creating a gauge is identical as creating a radar chart:
Loading required modules
import * as am5 from "@amcharts/amcharts5";
import * as am5xy from "@amcharts/amcharts5/xy";
import * as am5radar from "@amcharts/amcharts5/radar";
<script src="https://cdn.amcharts.com/lib/5/index.js"></script>
<script src="https://cdn.amcharts.com/lib/5/xy.js"></script>
<script src="https://cdn.amcharts.com/lib/5/radar.js"></script>
Creating chart instance
let root = am5.Root.new("chartdiv");
let chart = root.container.children.push(
  am5radar.RadarChart.new(root, {})
);
var root = am5.Root.new("chartdiv");
var chart = root.container.children.push(
  am5radar.RadarChart.new(root, {})
);
Axes
Adding axes
Gauges are one-dimensional chart, that's why we will only need one circular axis here.
We can use any axis type in gauge/radar, by pushing it into chart's xAxes list:
let axis = chart.xAxes.push(
  am5xy.ValueAxis.new(root, {
    renderer: am5radar.AxisRendererCircular.new(root, {})
  })
);
var axis = chart.xAxes.push(
  am5xy.ValueAxis.new(root, {
    renderer: am5radar.AxisRendererCircular.new(root, {})
  })
);
Axis scale
Since gauges do not have any actual series, its axis can't calculate it's own scale, so we will need to set it manually using axis' min and max settings:
let axis = chart.xAxes.push(
  am5xy.ValueAxis.new(root, {
    min: 0,
    max: 100,
    renderer: am5radar.AxisRendererCircular.new(root, {})
  })
);
var axis = chart.xAxes.push(
  am5xy.ValueAxis.new(root, {
    min: 0,
    max: 100,
    renderer: am5radar.AxisRendererCircular.new(root, {})
  })
);
Grid and ticks
Grid and ticks can be configured using like on any other axis: via its grid.template and ticks.template:
// Create axis renderer
let axisRenderer = am5radar.AxisRendererCircular.new(root, {
  strokeOpacity: 0.1,
  minGridDistance: 30
});

// Enable ticks
axisRenderer.ticks.template.setAll({
  visible: true,
  strokeOpacity: 0.5
});

// Disable grid
axisRenderer.grid.template.setAll({
  visible: false
});
// Create axis renderer
var axisRenderer = am5radar.AxisRendererCircular.new(root, {
  strokeOpacity: 0.1,
  minGridDistance: 30
});

// Enable ticks
axisRenderer.ticks.template.setAll({
  visible: true,
  strokeOpacity: 0.5
});

// Disable grid
axisRenderer.grid.template.setAll({
  visible: false
});
For more information about configuration of grid and ticks, refer to "Axes: Grid" and "Axes: Ticks".
Axis configuration
For more information on how to configure axes - labels, ticks, grid, individual radii and angles - refer to the "Radar axes" tutorial.
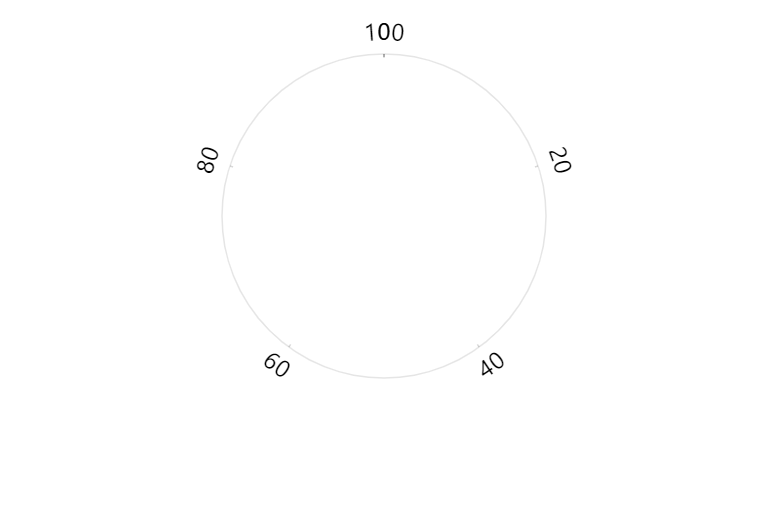
Start/end angles
Gauges (radar chart) is not limited to a full circle. It can start and end at any angle.
For that we have to chart's settings: startAngle and radarAngle.
These are numeric values denoting degrees.
A zero angle is one that goes from the center of the chart directly to right.
Defaults are -90 (startAngle) and 270 (endAngle) forming full circle starting at vertical line up.
We can change that any way we want.
let chart = root.container.children.push(
  am5radar.RadarChart.new(root, {
    startAngle: -180,
    endAngle: 0
  })
);
var chart = root.container.children.push(
  am5radar.RadarChart.new(root, {
    startAngle: -180,
    endAngle: 0
  })
);
The above will result in a horizontal semi-circle:
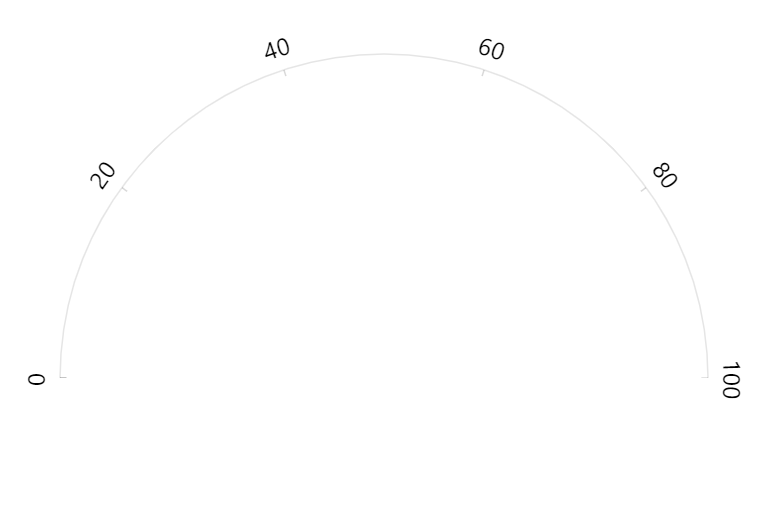
{ startAngle: -180, endAngle: 0 }See the Pen Radar chart with custom angles by amCharts team (@amcharts) on CodePen.
Chart radius
Radar chart (which is used for gauges) have two radius settings:
radius- outer radius.innerRadius- inner radius.
Both can be either percent value (relative to available space) or fixed pixel value.
radius is set to 80% by default to leave some space for possible ticks and labels.
innerRadius (default: 0) percent value is relative to the chart's radius, rather than available space.
We can also use negative values in innerRadius. Those will mean pixel distance from the outer radius. This allows creating fixed-width bands.
The inner radius will affect grid length as well as width of the bands.
let chart = root.container.children.push(
  am5radar.RadarChart.new(root, {
    radius: am5.percent(95),
    innerRadius: -20
  })
);
var chart = root.container.children.push(
  am5radar.RadarChart.new(root, {
    radius: am5.percent(95),
    innerRadius: -20
  })
);
For more information about chart radii settings, refer to "Radar chart: Radius".
Bands
To add colored bands to axis, we can use axis ranges.
Creating a range
Creating an axis range requires:
- Creating an axis data item using axis'
makeDataItem()method. - Creating an axis range from a data item using axis'
createAxisRange()method. - Specifying start and end value/date/category (depending on axis type used) for the range.
// Create range axis data item
let rangeDataItem = axis.makeDataItem({
  value: 0,
  endValue: 70
});

// Create a range
let range = axis.createAxisRange(rangeDataItem);
// Create range axis data item
var rangeDataItem = axis.makeDataItem({
  value: 0,
  endValue: 70
});

// Create a range
var range = axis.createAxisRange(rangeDataItem);
For more information about setting start and end values depending on axis type, refer to "Axis ranges: Range start and end" tutorial.
Setting fill
Range fills are not visible by default. We need to configure them using axisFill setting, which is a generic object of type Graphics.
rangeDataItem.get("axisFill").setAll({
  fill: color,
  fillOpacity: 0.2
});
rangeDataItem.get("axisFill").setAll({
  fill: color,
  fillOpacity: 0.2
});
Band width
Bad widths depend on the chart's radius and innerRadius settings.
let chart = root.container.children.push(
  am5radar.RadarChart.new(root, {
    innerRadius: -20
  })
);
var chart = root.container.children.push(
  am5radar.RadarChart.new(root, {
    innerRadius: -20
  })
);
The above will make bands 2% the radius of the chart itself.
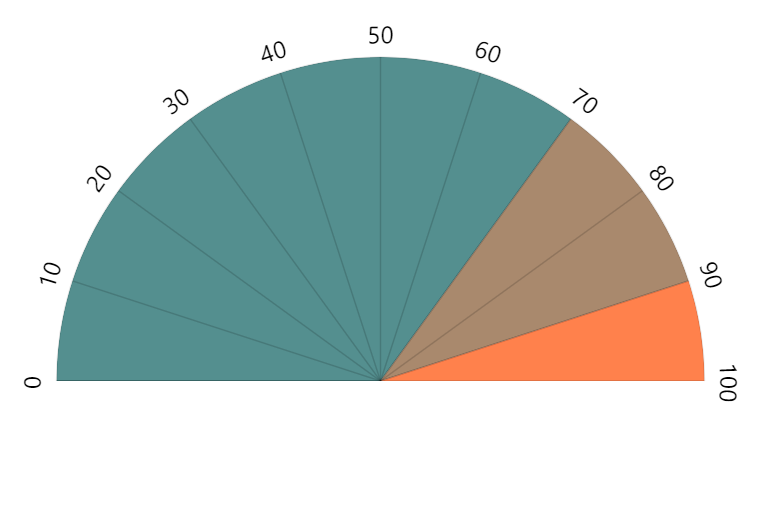
innerRadius: 0 (default)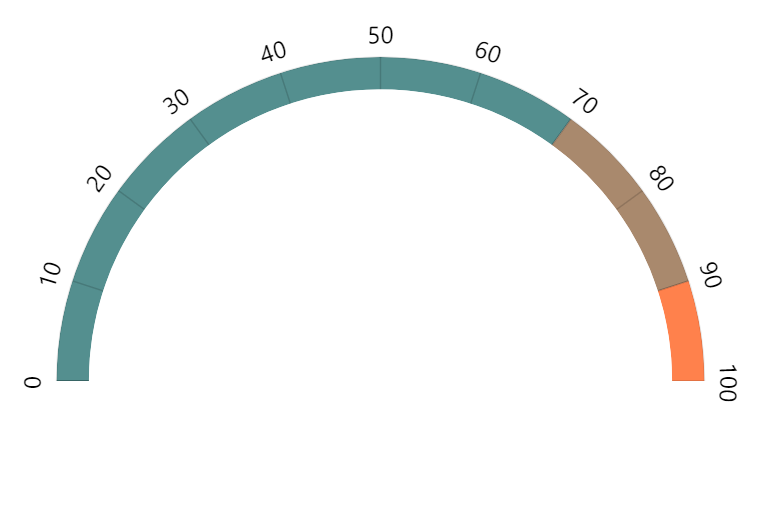
innerRadius: -30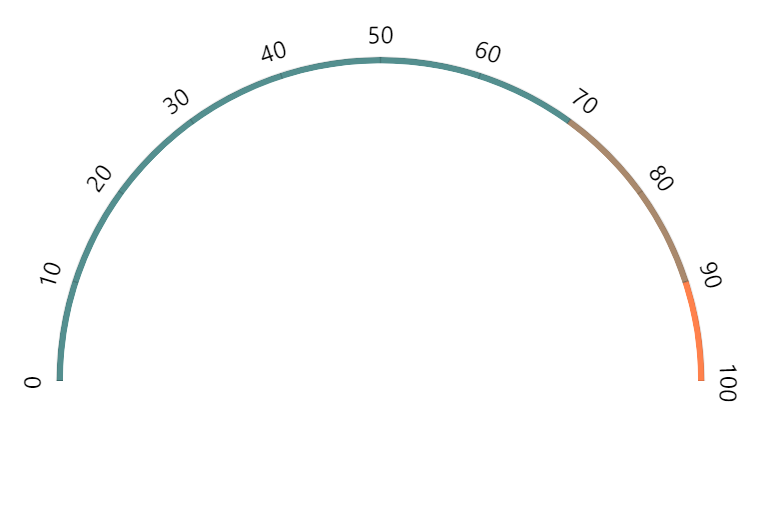
innerRadius: am5.percent(98)Variable-width bands
We can set radius and innerRadius directly on axis range fill data item, too.
This way we can make each range/band specific width:
rangeDataItem.get("axisFill").setAll({
  visible: true,
  fill: color,
  fillOpacity: 0.8,
  innerRadius: -45
});
rangeDataItem.get("axisFill").setAll({
  visible: true,
  fill: color,
  fillOpacity: 0.8,
  innerRadius: -45
});
See the Pen Gauge chart by amCharts team (@amcharts) on CodePen.
Band labels
To add labels to a band/axis range, use label setting:
rangeDataItem.get("label").setAll({
  text: "Warning",
  inside: true,
  radius: 5,
  fontSize: "0.9em",
  fill: am5.color(0xffffff)
});
rangeDataItem.get("label").setAll({
  text: "Warning",
  inside: true,
  radius: 5,
  fontSize: "0.9em",
  fill: am5.color(0xffffff)
});
See the Pen Gauge chart by amCharts team (@amcharts) on CodePen.
For more information about labels on a circular axis, refer to "Radar axes: Labels".
Clock hands
Adding
In amCharts 5, clock hands are added as an axis range bullet.
As a "sprite" for the axis bullet, we are going to be using special element of type ClockHand:
let handDataItem = axis.makeDataItem({
  value: 0
});

let hand = handDataItem.set("bullet", am5xy.AxisBullet.new(root, {
  sprite: am5radar.ClockHand.new(root, {
    radius: am5.percent(99)
  })
}));

axis.createAxisRange(handDataItem);
var handDataItem = axis.makeDataItem({
  value: 0
});

var hand = handDataItem.set("bullet", am5xy.AxisBullet.new(root, {
  sprite: am5radar.ClockHand.new(root, {
    radius: am5.percent(99)
  })
}));

axis.createAxisRange(handDataItem);
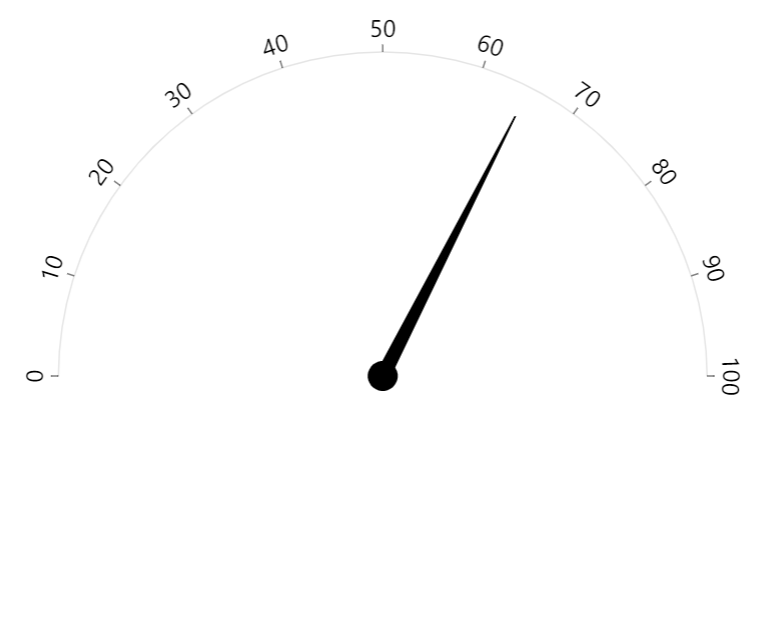
Setting value
Initial value
As per code snippet above, initial hand value is set via data item's value setting:
let handDataItem = axis.makeDataItem({
  value: 55
});
var handDataItem = axis.makeDataItem({
  value: 55
});
Dynamic value
To move the clock hand to different value, all we need to do is to set value setting of the data item again:
handDataItem.set("value", 20);
handDataItem.set("value", 20);
Or, if we want the hand to smoothly turn to a new value, we can animate its value setting:
handDataItem.animate({
  key: "value",
  to: 20,
  duration: 800,
  easing: am5.ease.out(am5.ease.cubic)
});
handDataItem.animate({
  key: "value",
  to: 20,
  duration: 800,
  easing: am5.ease.out(am5.ease.cubic)
});
Radius
There are three clock hand settings that effect its radii:
radius- radius from the center of the chart to the tip of the hand.innerRadius- radius from the center of the chart to the base of the hand.pinRadius- radius of the pin - a circle at the center of the chart.
All radii can be either set in absolute pixel values from the center of the chart, as well as percent values.
Percent values are relative to the axis radius.
Radii can also be set in negative absolute value. In such case the radius will be counted from the axis, rather then from the center of the chart.
let hand = handDataItem.set("bullet", am5xy.AxisBullet.new(root, {
  sprite: am5radar.ClockHand.new(root, {
    radius: am5.percent(85),
    innerRadius: 15,
    pinRadius: 10
  })
}));
var hand = handDataItem.set("bullet", am5xy.AxisBullet.new(root, {
  sprite: am5radar.ClockHand.new(root, {
    radius: am5.percent(85),
    innerRadius: 15,
    pinRadius: 10
  })
}));
radius: am5.percent(90)innerRadius: 0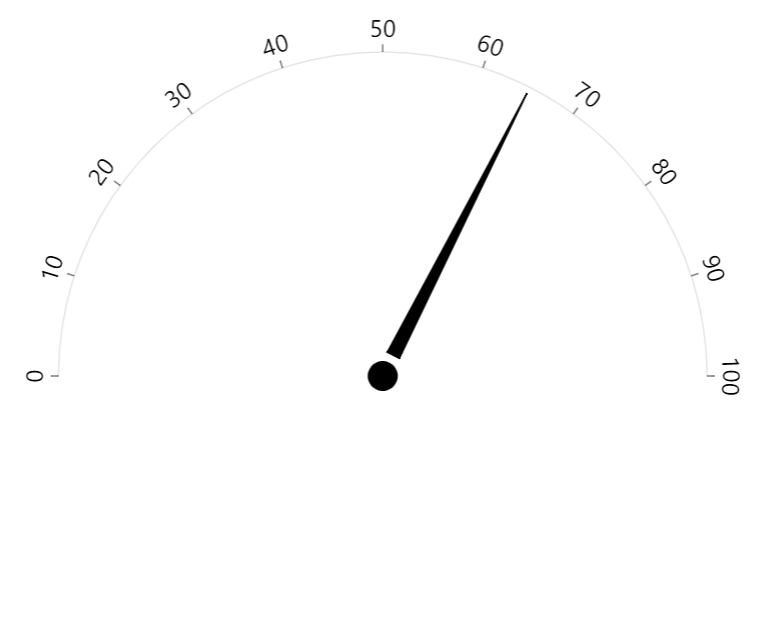
radius: am5.percent(98)innerRadius: 15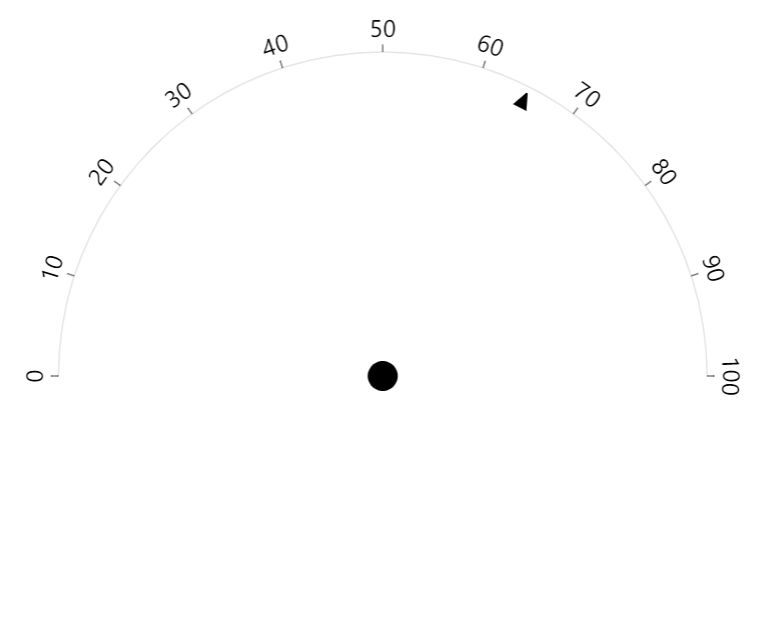
radius: -3innerRadius: -15Configuring hand elements
Setting colors
There are two properties on a clock hand: hand and pin.
They are both elements of type Graphics that can be used to set basic settings like fill and stroke.
hand.get("sprite").pin.setAll({
  fill: am5.color(0x946b49),
  fillOpacity: 0.5
});

hand.get("sprite").hand.setAll({
  fill: am5.color(0x946b49),
  fillOpacity: 0.9
});
hand.get("sprite").pin.setAll({
  fill: am5.color(0x946b49),
  fillOpacity: 0.5
});

hand.get("sprite").hand.setAll({
  fill: am5.color(0x946b49),
  fillOpacity: 0.9
});
Or, if we need to disable an element, we can simply set its visible setting:
hand.get("sprite").pin.set("visible", false);
hand.get("sprite").pin.set("visible", false);
Setting hand end widths
Besides radius settings, a clock hand also has two additional settings that control widths of hand's ends:
topWidth- width of the hand's tip, in pixels (default:1).bottomWidth- width of the hand's base, in pixels (default:10).
let hand = handDataItem.set("bullet", am5xy.AxisBullet.new(root, {
  sprite: am5radar.ClockHand.new(root, {
    topWidth: 5,
    bottomWidth: 5
  })
}));
var hand = handDataItem.set("bullet", am5xy.AxisBullet.new(root, {
  sprite: am5radar.ClockHand.new(root, {
    radius: am5.percent(85),
    topWidth: 5,
    bottomWidth: 5
  })
}));
The above will create a straight hand line, 5 pixel wide.
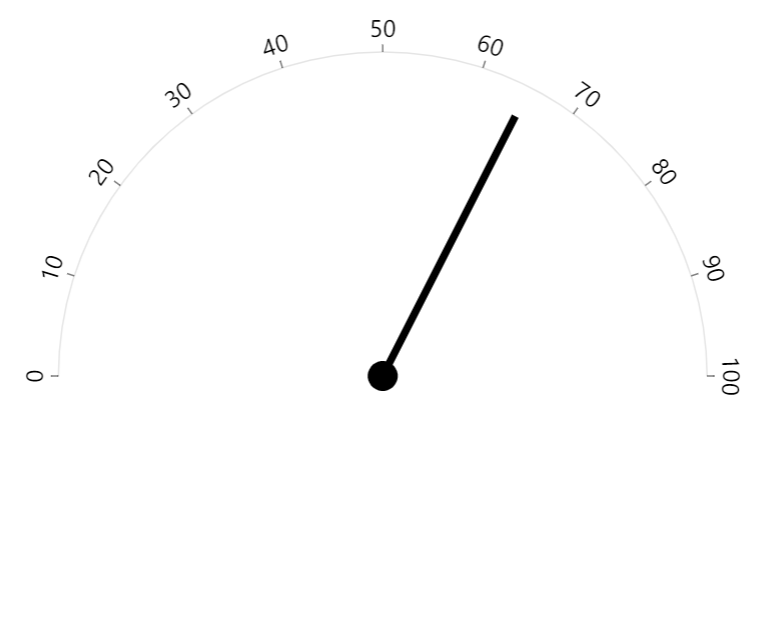
topWidth: 5bottomWidth: 5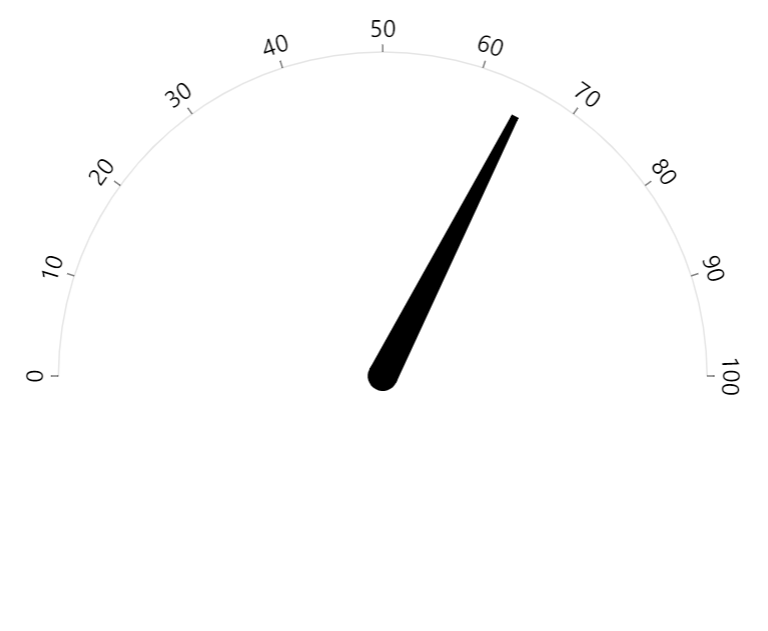
topWidth: 5bottomWidth: 20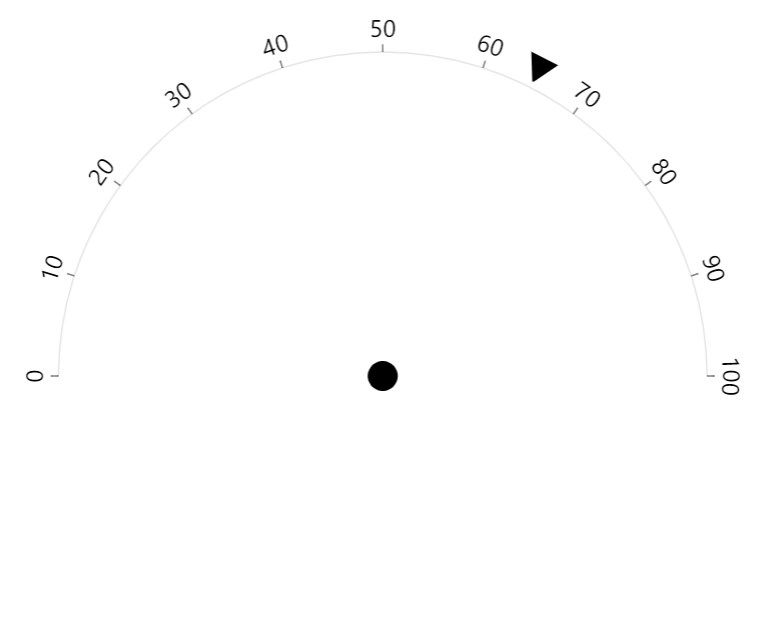
topWidth: 20bottomWidth: 1radius: am5.percent(110)innerRadius: am5percent(102)Disabling ticks and grid
Clock hand is an axis data item, which in turn may have a tick and grid enabled.
If we don't want those to show up next to our hand, we need to disable them:
handDataItem.get("grid").set("visible", false);
handDataItem.get("tick").set("visible", false);
handDataItem.get("grid").set("visible", false);
handDataItem.get("tick").set("visible", false);
Example
See the Pen Gauge chart with hand by amCharts team (@amcharts) on CodePen.
And here's a more advanced example, using multiple axes and hands at different start/end angles:
See the Pen amCharts 5: Multi-part Gauge by amCharts team (@amcharts) on CodePen.