This tutorial looks at the container elements comprising internal structure of an XY chart, and how we can configure them.
Built-in chart containers
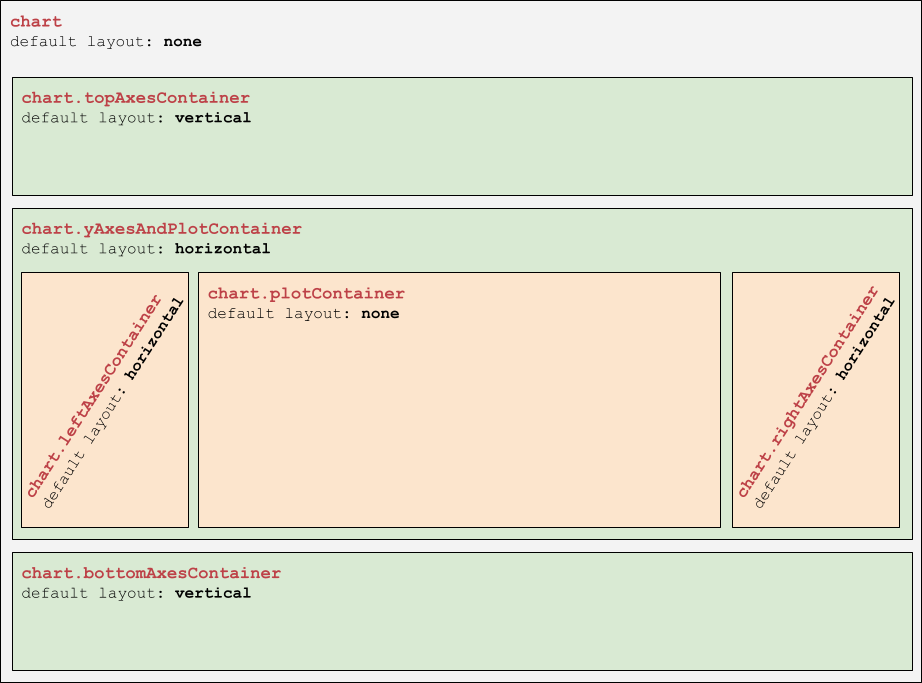
An XY chart comes with a predefined list of container hierarchy, accessible via chart's properties:
| Property | Default layout | Comment |
|---|---|---|
| N/A (chart itself) | none | Main chart container. |
topAxesContainer | vertical | X axes with renderer.opposite: true set are put into this container. |
bottomAxesContainer | vertical | X axes are put into this container |
yAxesAndPotContainer | horizontal | Houses sub-containers for Y axes and plots (series). |
leftAxesContainer | horizontal | Y axes are put into this container. |
rightAxesContainer | horizontal | Y axes with renderer.opposite: true set are put into this container. |
plotContainer | none | Series are plot in this container. |
Container structure
Configuring containers
All XY chart containers are elements of type Container.
We can use to configure them as we see fit.
Adding outline/background
Configuring outlines or background is done like with any other container: but adding a Rectangle element into its background setting.
The following code will add a fill and an outline for the whole chart's area:
chart.set("background", am5.Rectangle.new(root, {
  stroke: am5.color(0x297373),
  strokeOpacity: 0.5,
  fill: am5.color(0x297373),
  fillOpacity: 0.2
}));
chart.set("background", am5.Rectangle.new(root, {
  stroke: am5.color(0x297373),
  strokeOpacity: 0.5,
  fill: am5.color(0x297373),
  fillOpacity: 0.2
}));
plotContainer already has background created for it for internal reasons, so we can just re-use it instead of creating a new one:
chart.plotContainer.get("background").setAll({
  stroke: am5.color(0x297373),
  strokeOpacity: 0.5,
  fill: am5.color(0x297373),
  fillOpacity: 0.2
});
chart.plotContainer.get("background").setAll({
  stroke: am5.color(0x297373),
  strokeOpacity: 0.5,
  fill: am5.color(0x297373),
  fillOpacity: 0.2
});
See the Pen by amCharts team (@amcharts) on CodePen.
Changing layout
Changing layout of the container may alter the way and order chart elements are laid out.
For example, if we push the legend into chart's children list, setting its layout to vertical will put legend below everything else, while setting it to horizontal, will put legend to the right of the chart.
For more information, visit "Legend: Positioning".
Adding custom elements
We can use any chart container to add elements to it.
The following code will add a chart title to the top of the chart by pushing a Label element into topAxesContainer which is always on top:
chart.topAxesContainer.children.push(am5.Label.new(root, {
  text: "Sales breakdown by region",
  fontSize: 20,
  fontWeight: "400",
  x: am5.p50,
  centerX: am5.p50
}));
chart.topAxesContainer.children.push(am5.Label.new(root, {
  text: "Sales breakdown by region",
  fontSize: 20,
  fontWeight: "400",
  x: am5.p50,
  centerX: am5.p50
}));
See the Pen Fill on a plot container by amCharts team (@amcharts) on CodePen.