This tutorial looks at various aspects of creating column series.
Creating
Column series is created by instantiating ColumnSeries object using new() method, and pushing it into chart's series list:
let series = chart.series.push(
  am5xy.ColumnSeries.new(root, {
    name: "Series",
    xAxis: xAxis,
    yAxis: yAxis,
    valueYField: "value",
    valueXField: "date"
  })
);
var series = chart.series.push(
  am5xy.ColumnSeries.new(root, {
    name: "Series",
    xAxis: xAxis,
    yAxis: yAxis,
    valueYField: "value",
    valueXField: "date"
  })
);
Configuring appearance
Stroke and fill colors
Like with any series, it comes with stroke and fill color pre-set from the theme.
Should we want to override theme's color, we can set it's stroke (column outline) and/or fill settings.
let series = chart.series.push(
  am5xy.ColumnSeries.new(root, {
    name: "Series",
    xAxis: xAxis,
    yAxis: yAxis,
    valueYField: "value",
    valueXField: "date",
    fill: am5.color(0x095256),
    stroke: am5.color(0x095256)
  })
);
var series = chart.series.push(
  am5xy.ColumnSeries.new(root, {
    name: "Series",
    xAxis: xAxis,
    yAxis: yAxis,
    valueYField: "value",
    valueXField: "date",
    fill: am5.color(0x095256),
    stroke: am5.color(0x095256)
  })
);
Column appearance settings
Stroke (column border) and fill colors are automatically used from series settings. All other options can be configured using series' element templates.
In column series there's only one element template: columns.template.
Let's make column fill semi-transparent using fillOpacity setting, as well as the border heavier, with rounded top corners:
series.columns.template.setAll({
  fillOpacity: 0.5,
  strokeWidth: 2,
  cornerRadiusTL: 5,
  cornerRadiusTR: 5
});
series.columns.template.setAll({
  fillOpacity: 0.5,
  strokeWidth: 2,
  cornerRadiusTL: 5,
  cornerRadiusTR: 5
});
See the Pen LineSeries using locationX by amCharts team (@amcharts) on CodePen.
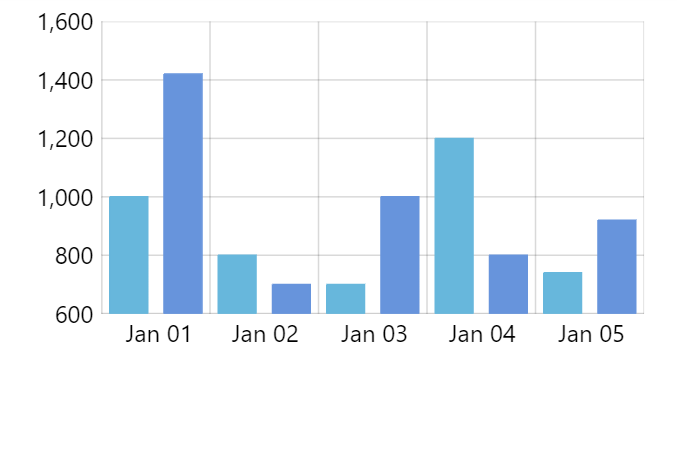
Clustering
Normally, multiple column series will "cluster", i.e. will show their columns reduced in width side by side.
We can use setting clustered to disable clustering for particular series. It can be useful in a number of situations, most commonly when creating Gantt or similar charts using floating columns.
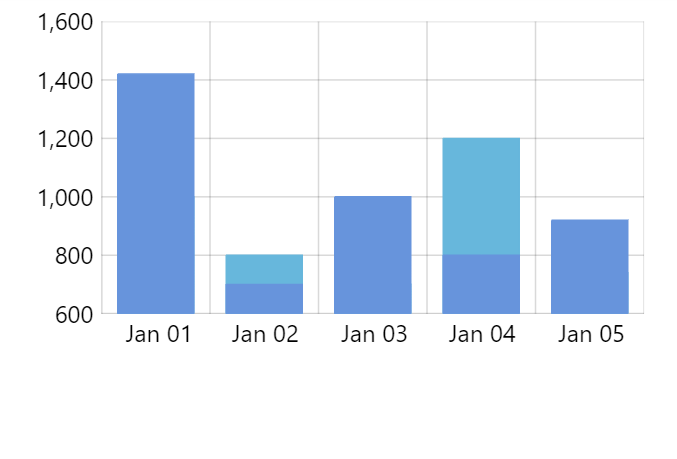
Stacking
Enabling stacking
Stacking for column series is enabled just like for any other XY series: by setting its stacked setting to true.
let series = chart.series.push(
  am5xy.ColumnSeries.new(root, {
    name: name,
    xAxis: xAxis,
    yAxis: yAxis,
    valueYField: "value",
    valueXField: "date",
    stacked: true
  })
);
var series = chart.series.push(
  am5xy.ColumnSeries.new(root, {
    name: name,
    xAxis: xAxis,
    yAxis: yAxis,
    valueYField: "value",
    valueXField: "date",
    stacked: true
  })
);
MORE INFO For more information about negative and 100% stacking, please refer to "XY chart series: Stacked series".
Column width
Columns in series take up 80% of available space by default.
It can be controlled via series columns.template and its width setting (or height if we have a chart with horizontal bars).
width (or height) can either be set in percent value relative to the space available for the series:
series.columns.template.setAll({
  width: am5.percent(100)
});
series.columns.template.setAll({
  width: am5.percent(100)
});
It can also be set in absolute pixel value:
series.columns.template.setAll({
  width: 5
});
series.columns.template.setAll({
  width: 5
});
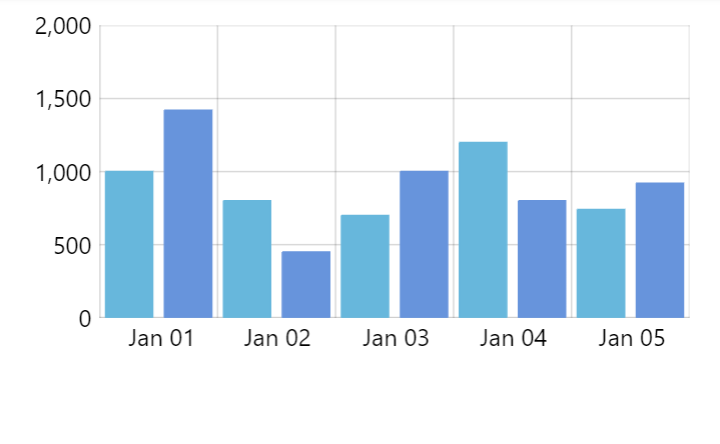
width: am5.percent(80) (default)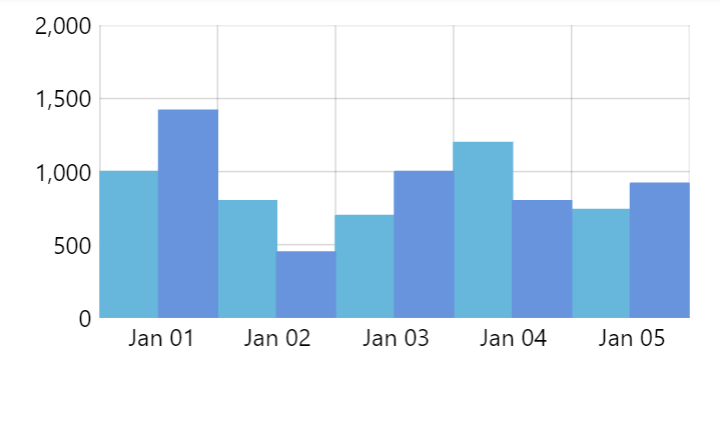
width: am5.percent(100)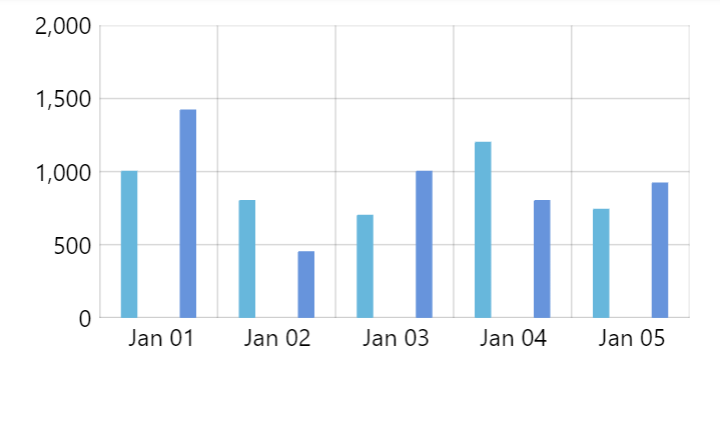
width: 20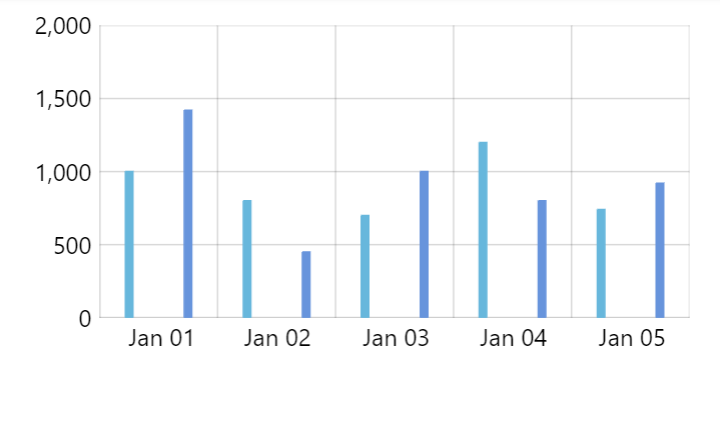
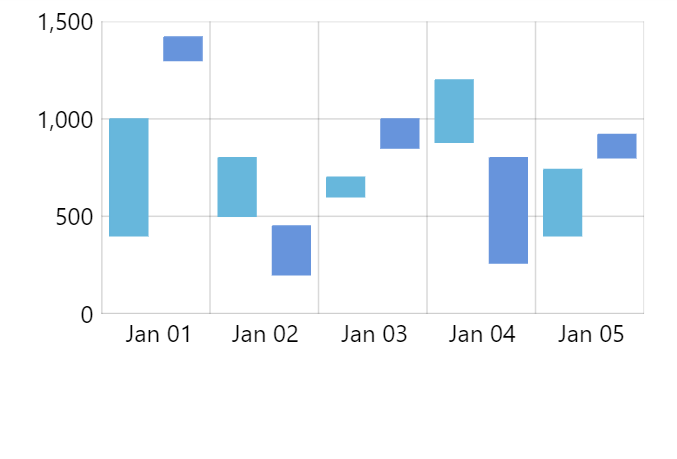
width: 5Floating columns
Normally, columns start at base value (zero). We can make columns start at different values using open data fields: openValueXField or openValueYField.
let series = chart.series.push(
  am5xy.ColumnSeries.new(root, {
    name: name,
    xAxis: xAxis,
    yAxis: yAxis,
    valueYField: "value",
    valueXField: "date",
    openValueYField: "openValue"
  })
);
var series = chart.series.push(
  am5xy.ColumnSeries.new(root, {
    name: name,
    xAxis: xAxis,
    yAxis: yAxis,
    valueYField: "value",
    valueXField: "date",
    openValueYField: "openValue"
  })
);
The above will mean that columns bottom will start at whatever number is in "openValue" in data, and will end at "value".
See the Pen Styling ColumnSeries by amCharts team (@amcharts) on CodePen.
NOTE For horizontal bars, we would use openValueXField instead.
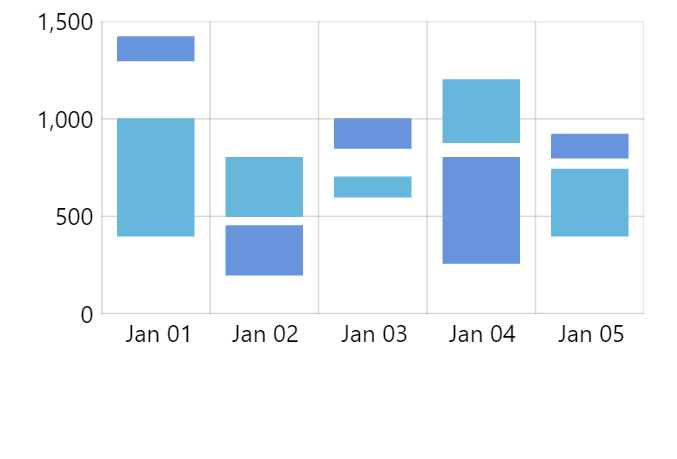
Value-dependent coloring
We can use states to apply different coloring to columns.template based on whether value of the column is higher or lower than the previous column in series.
If the value is higher, the series will attempt to apply a riseFromPrevious state to the column.
If the value is lower, a dropFromPrevious will be applied instead.
We can create those states for our columns.template to make use of this feature:
series.columns.template.states.create("riseFromPrevious", {
  fill: am5.color(0x76b041),
  stroke: am5.color(0x76b041)
});

series.columns.template.states.create("dropFromPrevious", {
  fill: am5.color(0xe4572e),
  stroke: am5.color(0xe4572e)
});
series.columns.template.states.create("riseFromPrevious", {
  fill: am5.color(0x76b041),
  stroke: am5.color(0x76b041)
});

series.columns.template.states.create("dropFromPrevious", {
  fill: am5.color(0xe4572e),
  stroke: am5.color(0xe4572e)
});
Naturally, we can also modify global theme as well:
root.defaultTheme.rule("RoundedRectangle", ["series", "column"]).create("riseFromPrevious", {
  fill: am5.color(0x76b041),
  stroke: am5.color(0x76b041)
});

root.defaultTheme.rule("RoundedRectangle", ["series", "column"]).create("dropFromPrevious", {
  fill: am5.color(0xe4572e),
  stroke: am5.color(0xe4572e)
});
See the Pen Styling ColumnSeries by amCharts team (@amcharts) on CodePen.
Events
The most convenient way to add events to a column series is to set those on its column template.
The following will add a click event to a series columns:
series.columns.template.events.on("click", function(ev) {
  // column id
  console.log("Clicked on a column", ev.target.uid);
  // data item
  console.log(ev.target.dataItem);
  // your original data object
  console.log(ev.target.dataItem.dataContext);
  // series
  console.log(ev.target.dataItem.component)
});
Turbo mode
Data-heavy Column series (and derivatives like Candlestick series) can get sluggish when rendering them.
For such setups, "turbo" mode can be enabled. It will simplify rendering process, drawing columns directly on canvas, speeding it significantly in the process.
let series = chart.series.push(
  am5xy.ColumnSeries.new(root, {
    name: "Series",
    xAxis: xAxis,
    yAxis: yAxis,
    valueYField: "value",
    valueXField: "date",
    turboMode: true
  })
);
var series = chart.series.push(
  am5xy.ColumnSeries.new(root, {
    name: "Series",
    xAxis: xAxis,
    yAxis: yAxis,
    valueYField: "value",
    valueXField: "date",
    turboMode: true
  })
);
The drawbacks of the "turbo mode" is that some of the functionality will not be available:
- Adding interactive events to columns, like
pointeroverevents. - Rounded corners are not supported.