Map chart is a chart type used to display geographical maps. This tutorial walks through the basics of creating such charts.
Loading required modules
Map charts require two amCharts 5 modules: "index" and "map".
You can import those in your TypeScript / ES6 application as JavScript modules:
import * as am5 from "@amcharts/amcharts5";
import * as am5map from "@amcharts/amcharts5/map";
For vanilla JavaScript applications and web pages, you can use "script" version:
<script src="https://cdn.amcharts.com/lib/5/index.js"></script>
<script src="https://cdn.amcharts.com/lib/5/map.js"></script>
MORE INFO For more information on installing amCharts 5 as well as loading modules refer to our "Getting started" tutorial.
Geodata (maps)
Besides modules that bring in actual functionality, we will also need to load a specific map we need to use. We call such map data "geodata".
Map chart uses geodata in GeoJSON format. There are hundreds of maps available for use with amCharts 5.
They are available as a zipped download from our downloads page, or as an NPM package @amcharts/amcharts5-geodata, or via CDN.
Geodata detail
Most of the maps come in two detail versions: "low" and "high".
Some global world and region maps come in three: "low", "high", and "ultra".
High and ultra detail maps offer finer maps, but they're much bigger files to load, so we, as a developer, would need to weight pros and cons before choosing the correct file to use.
For most setups "low" detail should be enough.
File and directory structure
World/country maps
The name of the geodata files consist of a camel-cased country or region name, as well as detail suffix ("Low", "High", "Ultra"), e.g.: franceHigh or worldLow.
World and country-maps are located in the root directory of the geodata package. They can be loaded like this:
import am5geodata_worldLow from "@amcharts/amcharts5-geodata/worldLow";
<script src="https://cdn.amcharts.com/lib/5/geodata/worldLow.js"></script>
Regional maps
Regional maps are located in their respective sub-directories, e.g. region/usa/*.
The global name of the regional map will reflect its sub-directory structure.
For example, congressional district map of Florida would load like this:
import am5geodata_region_usa_congressional2022_worldLow from "@amcharts/amcharts5-geodata/region/usa/congressional2022/flLow";
<!-- Will load as a global <span style="background-color: inherit;font-family: inherit;font-size: inherit;color: initial">am5geodata_region_usa_congressional_worldLo</span>w variable -->
<script src="https://cdn.amcharts.com/lib/5/geodata/region/usa/congressional2022/worldLow.js"></script>
MORE INFOFor more information on how to use regional maps, visit "Using regional maps" tutorial.
Instantiating the chart
As with any chart type in amCharts 5, we'll need to start with creation of the Root element.
In it we will create an instance of MapChart class.
let root = am5.Root.new("chartdiv");
let chart = root.container.children.push(
  am5map.MapChart.new(root, {})
);
var root = am5.Root.new("chartdiv");
var chart = root.container.children.push(
  am5map.MapChart.new(root, {})
);
MORE INFO The notion of creating class instances using .new() method is described in "Creating a chart" section in the "Getting started" tutorial. Make sure you check it out.
Adding series
Map chart, like most of the charts, is a serial chart, which means that it requires at least one series to operate.
We create a series by calling its new() method and pushing the new object into chart's series list:
let polygonSeries = chart.series.push(
  am5map.MapPolygonSeries.new(root, {
    geoJSON: am5geodata_worldLow
  })
);
var polygonSeries = chart.series.push(
  am5map.MapPolygonSeries.new(root, {
    geoJSON: am5geodata_worldLow
  })
);
NOTE A MapPolygonSeries requires its geoJSON setting to bet set to a geodata of a particular map we need to show, but we'll get to that later.
Available series types
Map chart currently supports these four types of series:
| Class | Comment | |
|---|---|---|
MapPolygonSeries | Used to display shapes of countries and other regions (polygons). | More info |
MapLineSeries | Used to draw lines on the map. | More info |
MapPointSeries | Used to put markers on the map. | More info |
GraticuleSeries | Used to display a map grid. | More info |
For most of the map chart setups, it will require at least one polygon series to make sense.
Projections
Setting a projection
There's a lot of ways to translate spherical surface of a planet into a flat map. In cartography those are called projections.
To specify which projection to use, set chart's projection setting:
let chart = root.container.children.push(
  am5map.MapChart.new(root, {
    projection: am5map.geoMercator()
  })
);
var chart = root.container.children.push(
  am5map.MapChart.new(root, {
    projection: am5map.geoMercator()
  })
);
Built-in projections
Map chart supports a number of built-in projections:
| Projection | Function name | Sample |
|---|---|---|
| Albers USA (only suitable for U.S. maps) | am5map.geoAlbersUsa() | 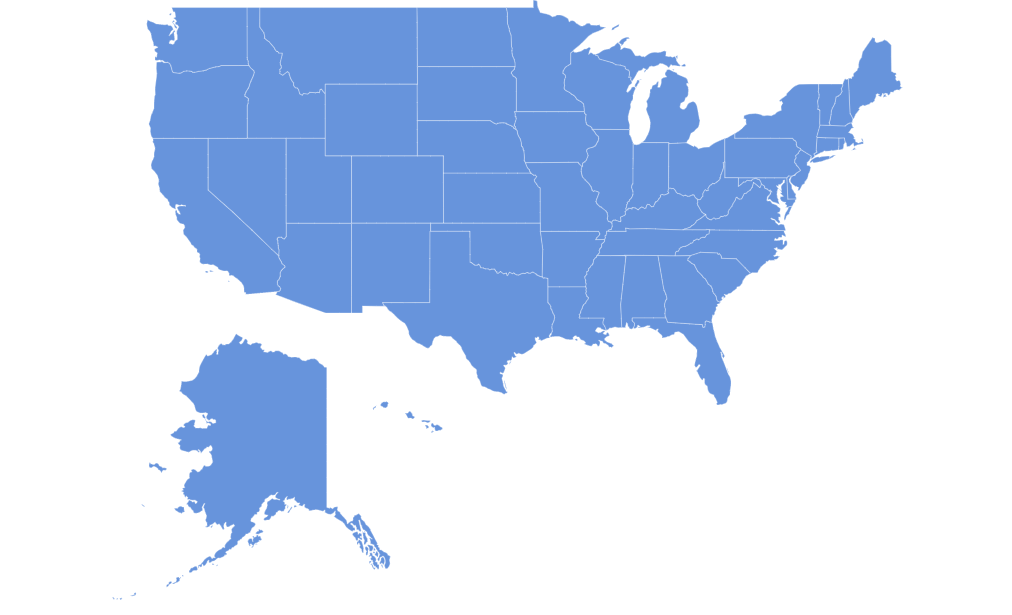 |
| Equal Earth | am5map.geoEqualEarth() | 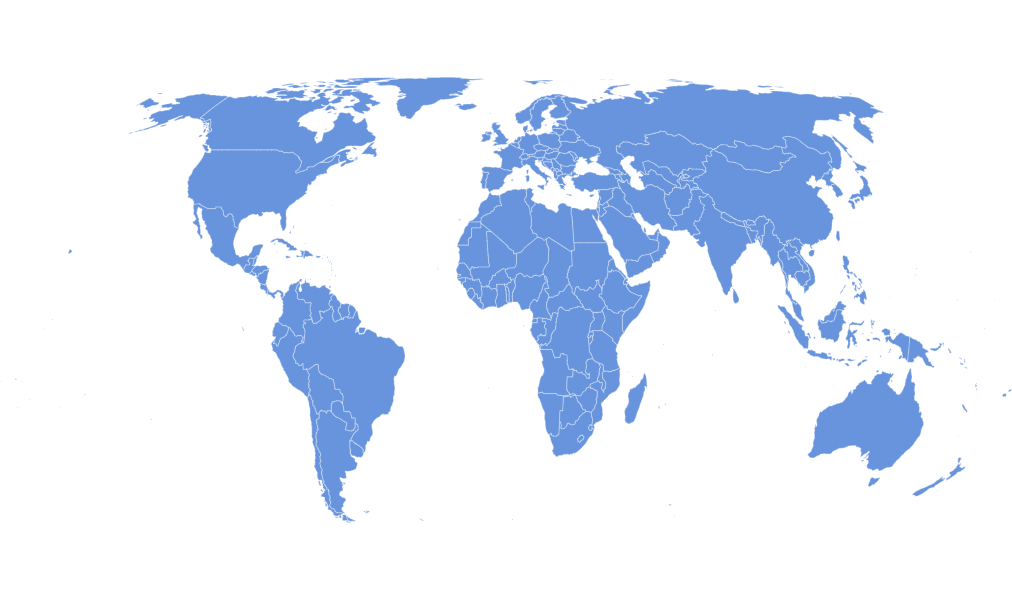 |
| Equirectangular | am5map.geoEquirectangular() | 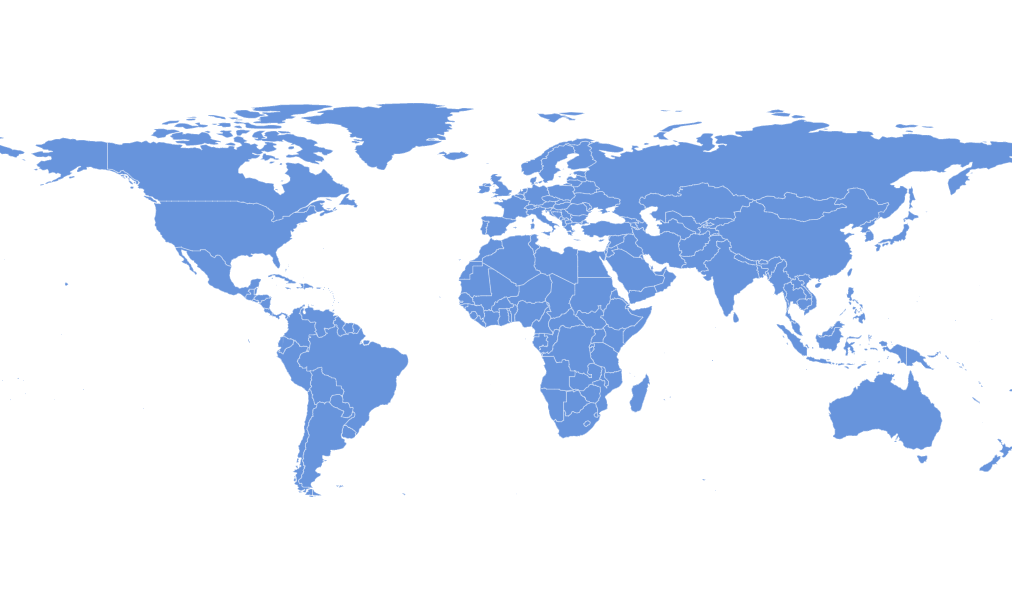 |
| Mercator (default) | am5map.geoMercator() | 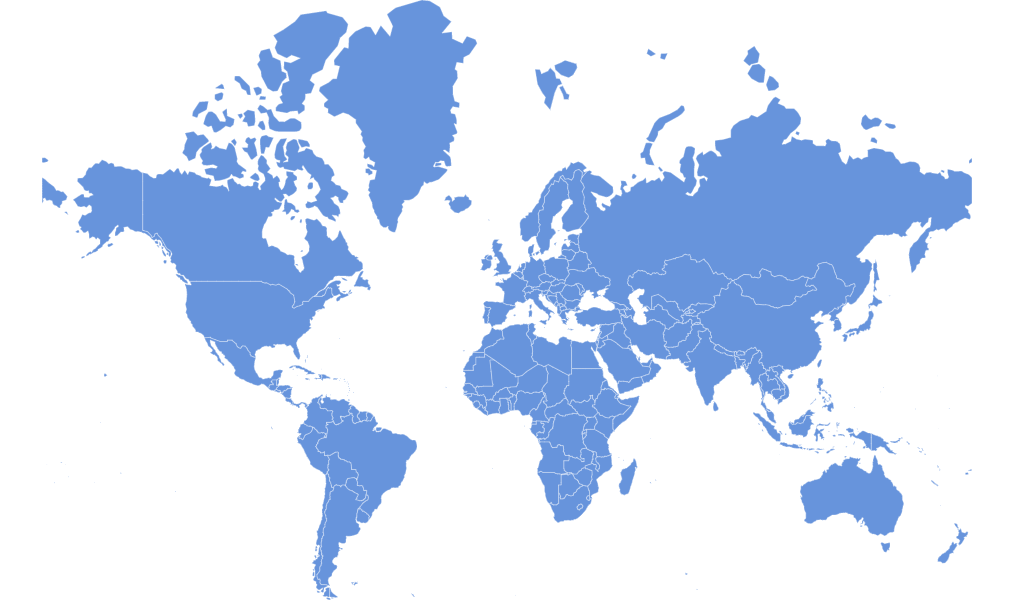 |
| Natural Earth 1 | am5map.geoNaturalEarth1() | 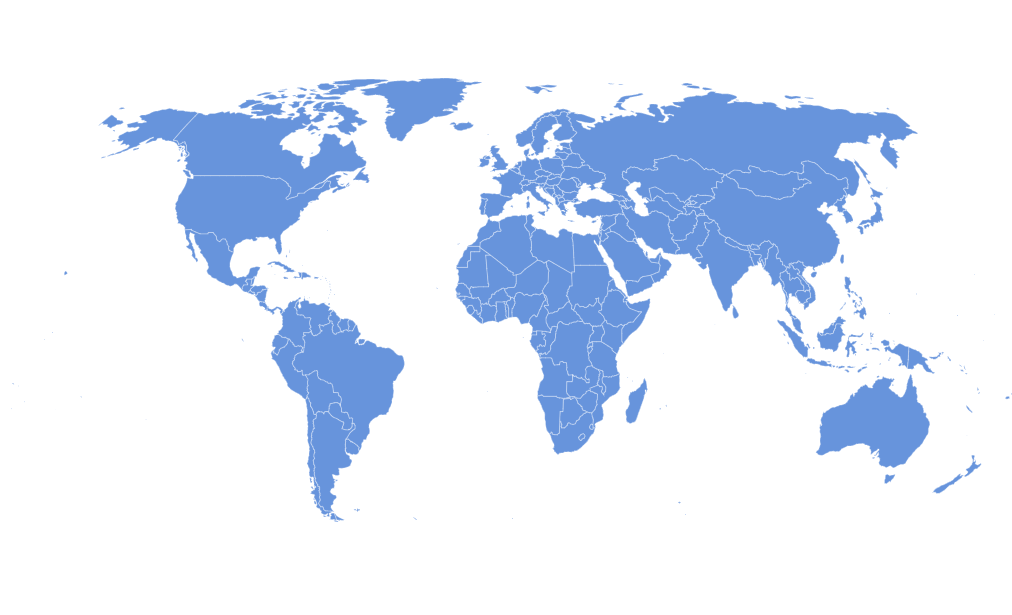 |
| Orthographic (globe) | am5map.geoOrthographic() | 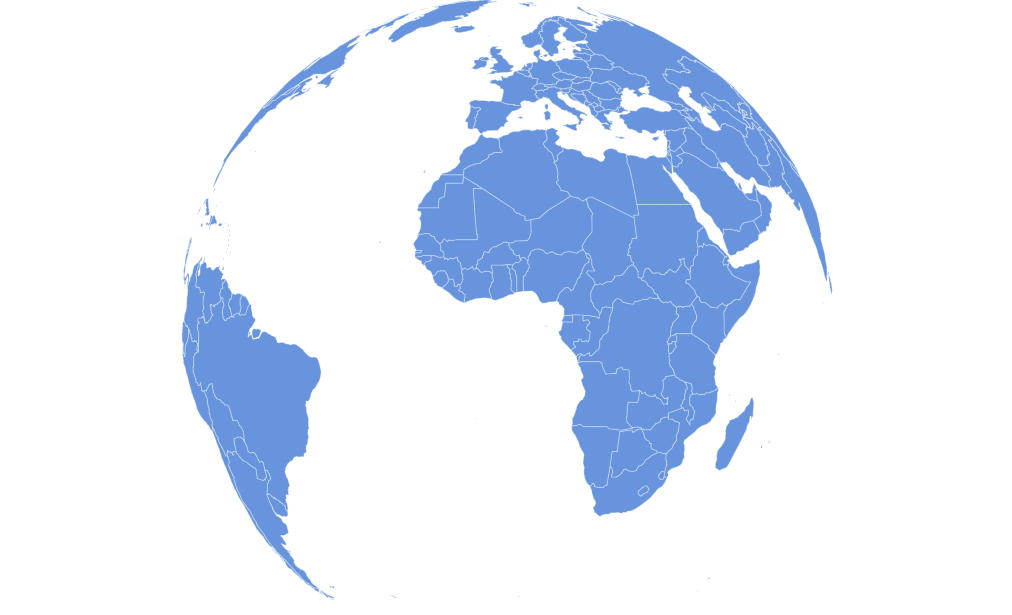 |
Using D3 projections
There are more projections available than the list above.
Map chart supports projections from the d3-geo-projection library.
Since those are not bundled with amCharts, you may need to load load them as modules from d3-geo-projection NPM package or compiled JS binaries from some CDN:
import {geoAitoff} from "d3-geo-projection@4";
<script src="https://cdn.jsdelivr.net/npm/d3-array@3"></script>
<script src="https://cdn.jsdelivr.net/npm/d3-geo@3"></script>
<script src="https://cdn.jsdelivr.net/npm/d3-geo-projection@4"></script>
Then it's just as easy as setting projection on a MapChart:
let chart = root.container.children.push(
  am5map.MapChart.new(root, {
    projection: geoAitoff
  })
);
var chart = root.container.children.push(
  am5map.MapChart.new(root, {
    projection: d3.geoAitoff
  })
);
See the Pen amCharts 5: Using D3 map projections by amCharts team (@amcharts) on CodePen.
Panning
There is a number of options for us when it comes how map behaves when is dragged (either with mouse or by touch).
Those are controlled by map chart's panX and panY settings. The former controls what happens when dragged horizontally, and the latter - vertically.
For example, we can set up the map to rotate endlessly horizontally using panX: "rotateX":
let chart = root.container.children.push(
  am5map.MapChart.new(root, {
    panX: "rotateX"
  })
);
var chart = root.container.children.push(
  am5map.MapChart.new(root, {
    panX: "rotateX"
  })
);
For more information, refer to "Panning and zooming the map" tutorial.
Zooming
Zooming of the map can be done in a number of ways: zoom control, mouse wheel or pinch gestures, API, or custom events.
For more information, refer to "Panning and zooming the map" tutorial.
Centering the map
The map will center itself in the coordinate between its boundaries. On a world map that is usually zero coordinate: 0 latitude / 0 longitude.
We can re-center the map using its rotationX (longitude), rotationY (latitude), and/or rotationZ (Z axis).
rotationX
rotationY
rotationZThey are numeric settings to shift map center by certain amount of degrees.
To have a map centered on a Pacific ocean, we could do this:
let chart = root.container.children.push(
  am5map.MapChart.new(root, {
    rotationX: -160
  })
);
var chart = root.container.children.push(
  am5map.MapChart.new(root, {
    rotationX: -160
  })
);
Complete example
import * as am5 from "@amcharts/amcharts5";
import * as am5map from "@amcharts/amcharts5/map";
import am5geodata_worldLow from "@amcharts/amcharts5-geodata/worldLow";

// Create root and chart
let root = am5.Root.new("chartdiv");
let chart = root.container.children.push(
  am5map.MapChart.new(root, {
    panX: "rotateX",
    projection: am5map.geoNaturalEarth1()
  })
);


// Create polygon series
let polygonSeries = chart.series.push(
  am5map.MapPolygonSeries.new(root, {
    geoJSON: am5geodata_worldLow,
    exclude: ["AQ"]
  })
);
<script src="https://cdn.amcharts.com/lib/5/index.js"></script>
<script src="https://cdn.amcharts.com/lib/5/map.js"></script>
<script src="https://cdn.amcharts.com/lib/5/geodata/worldLow.js"></script>

<div id="chartdiv"></div>

<script>
// Create root and chart
var root = am5.Root.new("chartdiv");
var chart = root.container.children.push(
  am5map.MapChart.new(root, {
    panX: "rotateX",
    projection: am5map.geoNaturalEarth1()
  })
);

// Create polygon series
var polygonSeries = chart.series.push(
  am5map.MapPolygonSeries.new(root, {
    geoJSON: am5geodata_worldLow,
    exclude: ["AQ"]
  })
);
</script>
See the Pen Map chart by amCharts team (@amcharts) on CodePen.
Map background
There are a couple of ways to attach a background (water fill) for the map.
Both of them are described in "Map polygon series: Background polygon" tutorial.
Heat maps
It's possible to create heat maps (choropleth) maps using heat rules.
For detailed instructions and live samples, make sure to check "Heat rules" tutorial.
Additional controls
Zoom control
Map chart supports built-in control that adds zooming chart via handy buttons.
To add it, simply instantiate a ZoomControl and set it to map chart's zoomControl setting.
chart.set("zoomControl", am5map.ZoomControl.new(root, {}));
chart.set("zoomControl", am5map.ZoomControl.new(root, {}));
For more information, refer to "Panning and zooming the map: Zoom control" tutorial.