This tutorial will look into all aspects of using bullets on series.
Creating a series bullet
Each series has a bullets property, which is a List of functions.
A function is responsible for returning a Bullet object.
Whenever series needs to create a bullet for a specific data item, it will call the function and expect it to return a new bullet, which then be displayed on actual chart.
So, creating a bullet involves pushing a custom function into series' bullets list:
series.bullets.push(function(root) {
  return am5.Bullet.new(root, {});
});
series.bullets.push(function(root) {
  return am5.Bullet.new(root, {});
});
NOTEBullet function receives a root object instance as a first parameter. Since bullets can be created in a lot of different places (e.g. external legend), make sure that we use the passed in object to avoid any anomalies.
Bullet contents
Naturally, empty bullet is useless because it does not have anything to display, so we need to set its contents.
To do that, Bullet has a setting sprite which can be set to literally any other element: from something as simple as a Circle object to another full fledged chart.
series.bullets.push(function(root) {
  return am5.Bullet.new(root, {
    sprite: am5.Circle.new(root, {
      radius: 4,
      fill: series.get("fill")
    })
  });
});
series.bullets.push(function(root) {
  return am5.Bullet.new(root, {
    sprite: am5.Circle.new(root, {
      radius: 4,
      fill: series.get("fill")
    })
  });
});
The above will create a bullet with a circle.
Please note that bullets can be complex and will not inherit series colors automatically, hence we need to explicitly set its color to series color.
See the Pen Smoothed line series by amCharts team (@amcharts) on CodePen.
For an example of how to use images as bullets, refer to "Images" tutorial.
Adding directly to data item
It is possible to create bullets one by one, by adding them directly to the actual series' data items.
For that, series does have an addBullet(dataItem, bullet) method.
It accepts two parameters:
dataItem- a series data item to add bullet to.bullet- an instance ofBullet. Note that this is not a bullet-creating function, but an actualBulletinstance.
There are three steps to the process:
- Waiting for series to process data, i.e. its
datavalidatedevent kicks in. - Finding series data item to add bullet to.
- Adding the actual bullet using series method
addBullet().
Waiting for data
In order for data items to be available, we need to wait until series finishes processing its data. For that we'll need to watch for its datavalidated event kicking in.
series.events.once("datavalidated", function() {
  // Series data ready
});
series.events.once("datavalidated", function() {
  // Series data ready
});
Finding the data item
We will use axis' method getSeriesItem() to get the data item from series at specific position in axis.
Before that
On a DateAxis we will use its method dateToPosition() to convert specific data/time to an axis position, we can then use in getSeriesItem().
series.events.once("datavalidated", function() {
  let axisPosition = xAxis.dateToPosition(new Date(2023, 5, 12));
  let seriesDataItem = xAxis.getSeriesItem(series, axisPosition, 0);
  // ...
});
series.events.once("datavalidated", function() {
  var axisPosition = xAxis.dateToPosition(new Date(2023, 5, 12));
  var seriesDataItem = xAxis.getSeriesItem(series, axisPosition, 0);
  // ...
});
Similarly, on a CategoryAxis we will use categoryToPosition() to find out what the position specific category is at.
series.events.once("datavalidated", function() {
  let axisPosition = xAxis.categoryToPosition("Research");
  let seriesDataItem = xAxis.getSeriesItem(series, axisPosition, 0);
  // ...
});
series.events.once("datavalidated", function() {
  var axisPosition = xAxis.categoryToPosition("Research");
  var seriesDataItem = xAxis.getSeriesItem(series, axisPosition, 0);
  // ...
});
Adding data item bullet
Now that we know the specific data item, we can use series' addBullet() method to add a bullet to it.
series.events.once("datavalidated", function() {
  let axisPosition = xAxis.categoryToPosition("Research");
  let seriesDataItem = xAxis.getSeriesItem(series, axisPosition, 0);

  series.addBullet(seriesDataItem, am5.Bullet.new(root, {
    sprite: am5.Circle.new(root, {
      radius: 10,
      fill: am5.color(0xffffff),
      stroke: series.get("stroke")
    });
  }));
});
series.events.once("datavalidated", function() {
  var axisPosition = xAxis.categoryToPosition("Research");
  var seriesDataItem = xAxis.getSeriesItem(series, axisPosition, 0);

  series.addBullet(seriesDataItem, am5.Bullet.new(root, {
    sprite: am5.Circle.new(root, {
      radius: 10,
      fill: am5.color(0xffffff),
      stroke: series.get("stroke")
    });
  }));
});
Below example adds several bullets at specific points on chart:
See the Pen Adding bullets at specific dates by amCharts team (@amcharts) on CodePen.
Positioning
By relative location
A Bullet object has two properties that help position them within the parent element/data item: locationX and locationY.
Those accept numeric values from 0 (zero) to 1 (one) indicating relative position within target element, with zero indicating beginning and one the end.
Some series (e.g. line series) do not have any dimension, so location settings will be ignored.
However in those series that do have elements with actual shapes (e.g. column series), location settings are super useful as it gives us flexibility over positioning of a bullet.
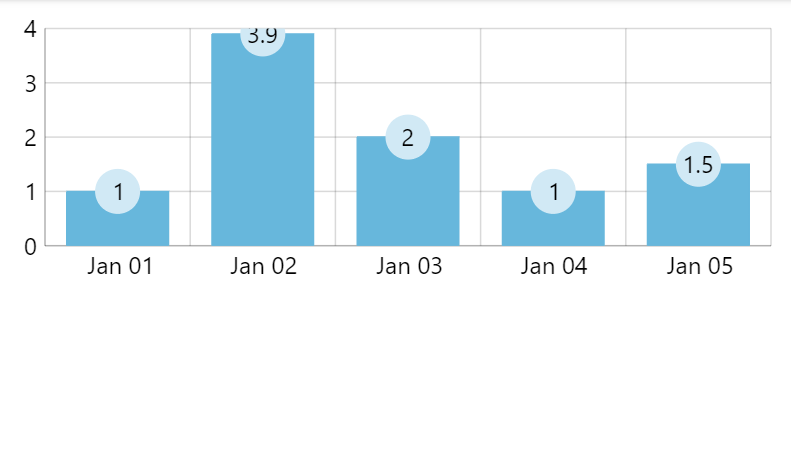
Let's put a Label bullet in the middle of a column in a column series:
series.bullets.push(function(root) {
  return am5.Bullet.new(root, {
    locationX: 0.5,
    locationY: 0.5,
    sprite: am5.Label.new(root, {
      text: "{valueY}",
      centerX: am5.percent(50),
      centerY: am5.percent(50),
      populateText: true
    })
  });
});
series.bullets.push(function(root) {
  return am5.Bullet.new(root, {
    locationX: 0.5,
    locationY: 0.5,
    sprite: am5.Label.new(root, {
      text: "{valueY}",
      centerX: am5.percent(50),
      centerY: am5.percent(50),
      populateText: true
    })
  });
});
NOTE Please note the populateText use above. This is needed to force Label to populate data placeholders with actual data.
See the Pen Line series with bullets by amCharts team (@amcharts) on CodePen.
Some series are represented by a single line. For example Chord, Sankey, or MapLineSeries.
In those cases, only locationX or locationY is used. I.e. on a horizontal Sankey diagram, locationX will be used, and locationY will be ignored altogether.
By data field
IMPORTANTPositioning bullets by data fields works only on an XYChart.
Some XY series can have multiple values - like for instance Candlesticks have open, high, low, close. We can instruct the bullet to attach to that specific value by using bullet's field setting.
It accepts these values: "open", "high", "low", "value" (default).
series.bullets.push(function(root, series) {
  return am5.Bullet.new(root, {
    field: "open",
    sprite: am5.Circle.new(root, {
      radius: 8,
      stroke: am5.color(0x000000),
      strokeWidth: 4,
      fill: am5.color(0xffffff)
    })
  });
});
series.bullets.push(function(root, series) {
  return am5.Bullet.new(root, {
    field: "open",
    sprite: am5.Circle.new(root, {
      radius: 8,
      stroke: am5.color(0x000000),
      strokeWidth: 4,
      fill: am5.color(0xffffff)
    })
  });
});
NOTESetting field makes the bullet completely ignore the locationX and locationY settings.
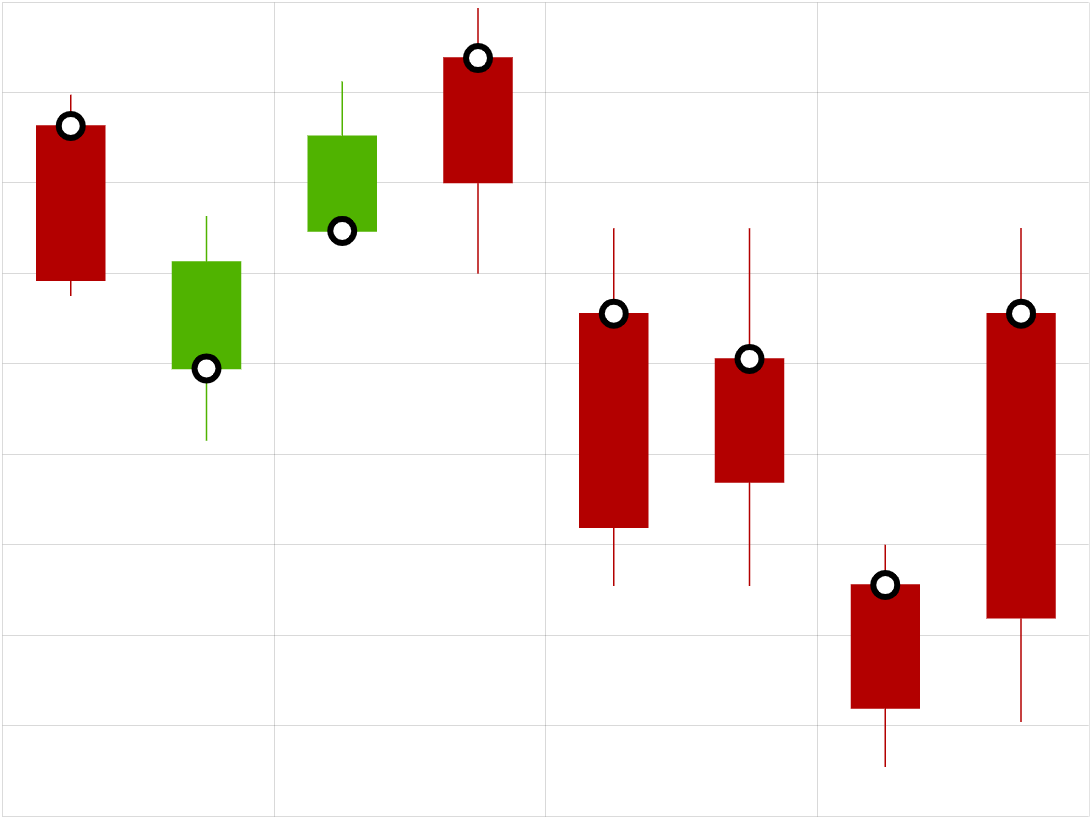
field: "open"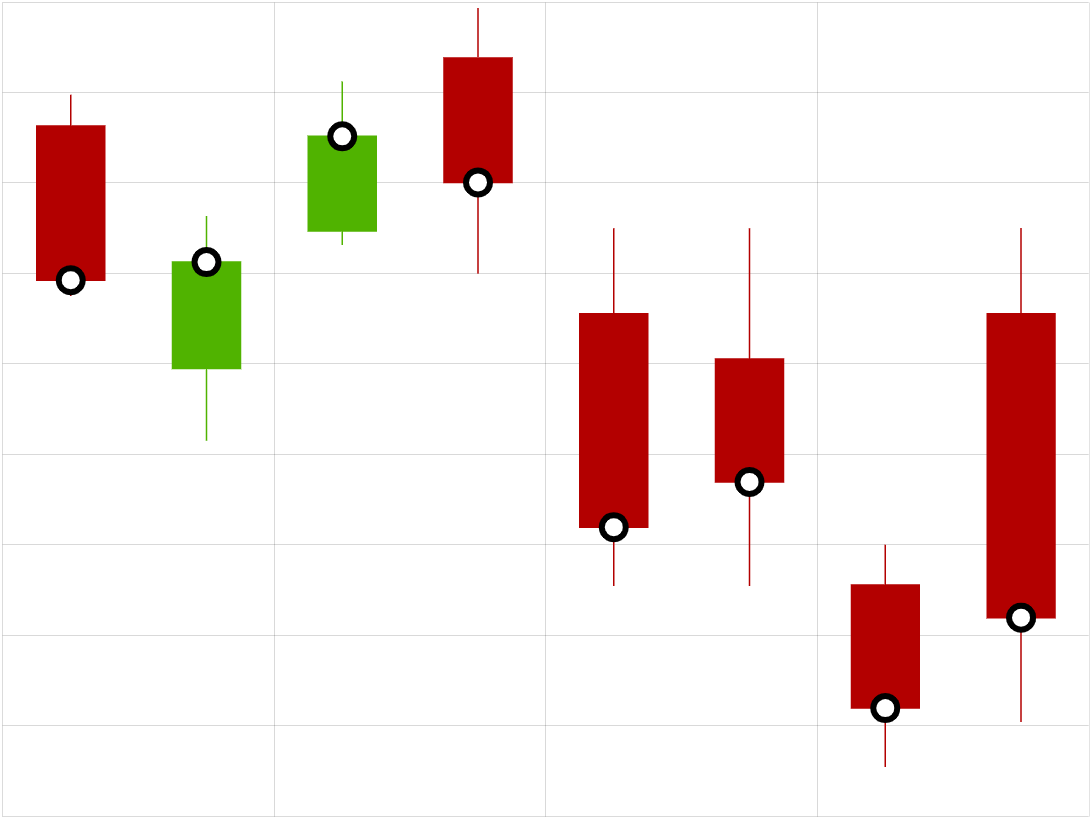
field: "value" (default)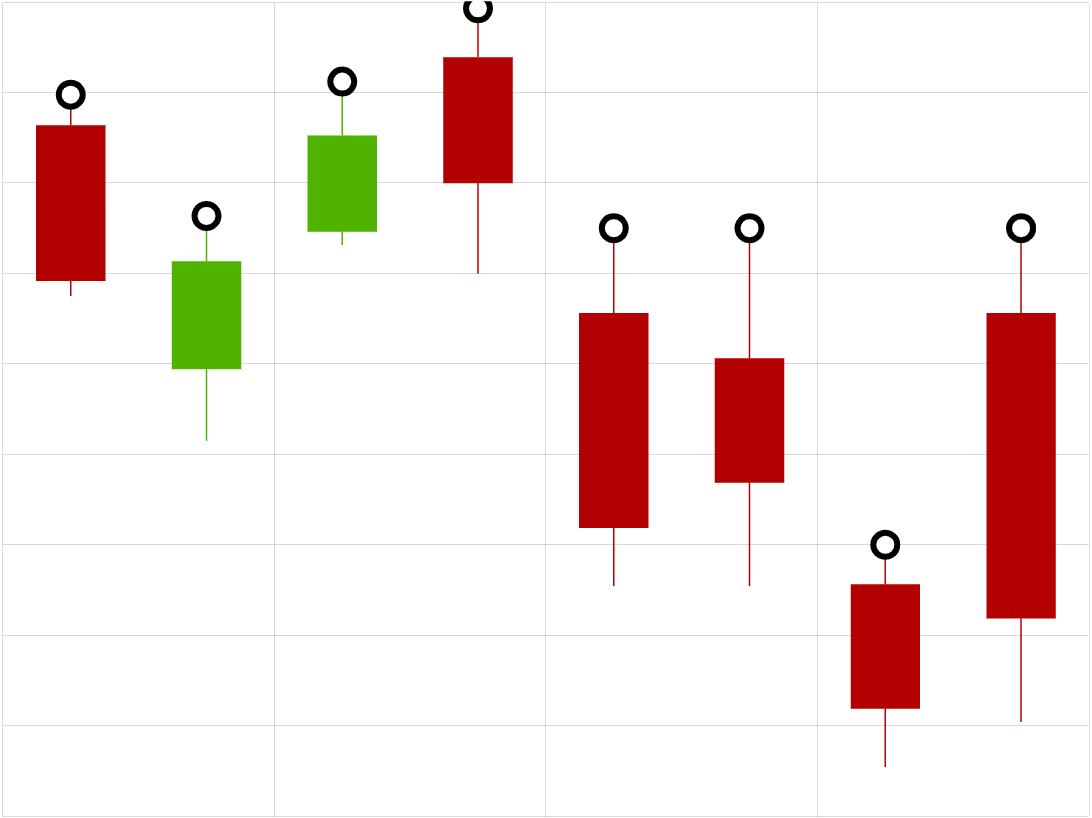
field: "high"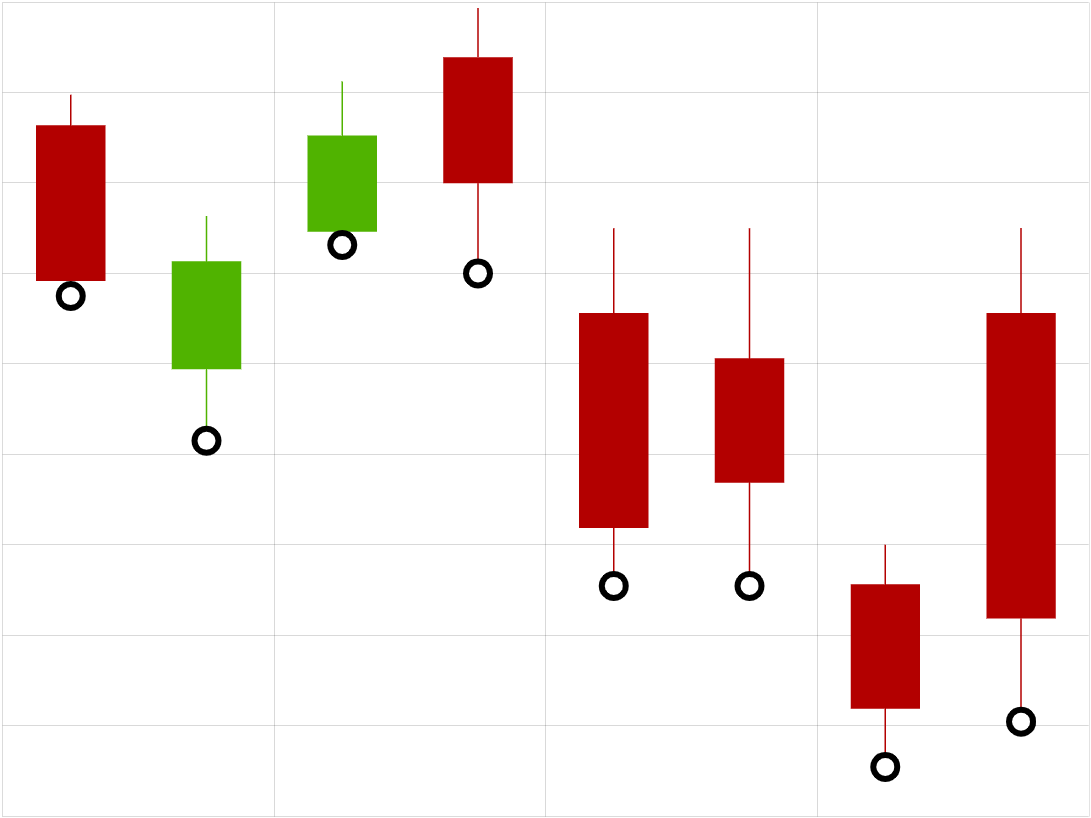
field: "low"See the Pen Positioning series bullets by data field by amCharts team (@amcharts) on CodePen.
Stacked bullets
Normally, bullets will be displayed at the specific location, regardless if there are any other bullets present in the same position.
We can instruct them to stack instead by setting bullet's stacked setting.
It accepts three values:
"up"- will stack bullets upwards."down"- will stack bullets downards."auto"- will stack bullets upwards or downwards depending on their relative vertical position in the chart.
See the Pen Stacked bullets by amCharts team (@amcharts) on CodePen.
Relation to data
Among other things, series will also pass relevant data item to the bullet.
That's why bullets can use data placeholders to populate text, as well as heat rules.
Data placeholders
Bullets that use Label as their sprite property can have its text populated using curly bracket enclosed data placeholders.
series.bullets.push(function(root) {
  return am5.Bullet.new(root, {
    sprite: am5.Label.new(root, {
      text: "{valueY}",
      populateText: true
    })
  });
});
series.bullets.push(function(root) {
  return am5.Bullet.new(root, {
    sprite: am5.Label.new(root, {
      text: "{valueY}",
      populateText: true
    })
  });
});
The above label will be replaced by the actual Y value of the related data item.
For more information on how data placeholders work, refer to "Data placeholders" tutorial.
Heat rules
Bullets can also benefit from heat rules.
For example circle bullet can have its radius assigned dynamically, according to range of values in the series.
For more information and examples, visit "Heat rules: Bullets".
Template fields
Template fields are way to override some settings for a series item, such as a bullet, via data.
It works by specifying templateField setting on an object, which should point to a key in data that holds that element's settings we want to override.
For an in-depth explanation how this works, refer to "Template fields" tutorial.
That said, there are some caveats when using template fields with a bullet.
The main one is that bullets are different from any other series object in that they are not created via template, but rather by custom function as a new element. This means that settings supplied during its creations will take precedence over ones that would be inherited via a template field.
The below code will not function correctly:
series.bullets.push(function(root) {
  return am5.Bullet.new(root, {
    sprite: am5.Circle.new(root, {
      radius: 5,
      // ERROR:
      // "fill" set directly on a new element will take precedence over one pulled in via templateField
      fill: am5.color(0xff0000),
      templateField: "bulletSettings"
    })
  });
});

series.data.setAll([{
  category: "C1",
  value: 100,
  bulletSettings: {
    fill: am5.color(0x00ff00)
  }
}, {
  category: "C2",
  value: 200,
  bulletSettings: {
    fill: am5.color(0x0000ff)
  }
}]);
The correct workaround is to use a separate template to set bullet's "default" settings, and pass it in as a third parameter to its new() method.
The following code will function correctly:
let bulletTemplate = am5.Template.new({
  // This will be default fill for bullets that do not have
  // it set via templateField
  fill: am5.color(0xE6E6E6)
});

series.bullets.push(function(root) {
  return am5.Bullet.new(root, {
    sprite: am5.Circle.new(root, {
      radius: 5,
      templateField: "bulletSettings"
    }, bulletTemplate)
  });
});

series.data.setAll([{
  category: "C1",
  value: 100,
  bulletSettings: {
    fill: am5.color(0x00ff00)
  }
}, {
  category: "C2",
  value: 200,
  bulletSettings: {
    fill: am5.color(0x0000ff)
  }
}]);
var bulletTemplate = am5.Template.new({
  // This will be default fill for bullets that do not have
  // it set via templateField
  fill: am5.color(0xE6E6E6)
});

series.bullets.push(function(root) {
  return am5.Bullet.new(root, {
    sprite: am5.Circle.new(root, {
      radius: 5,
      templateField: "bulletSettings"
    }, bulletTemplate)
  });
});

series.data.setAll([{
  category: "C1",
  value: 100,
  bulletSettings: {
    fill: am5.color(0x00ff00)
  }
}, {
  category: "C2",
  value: 200,
  bulletSettings: {
    fill: am5.color(0x0000ff)
  }
}]);
See the Pen Using templateField with bullets by amCharts team (@amcharts) on CodePen.
Selectively displaying bullets
The function that returns a bullet, can also return nothing.
If this happens, the bullet is not displayed.
This allows us to include our own logic into bullet function to display bullets only in places where we want them.
The following code will only show bullets if data for the data item contains showBullets: true:
series.bullets.push(function(root, series, dataItem) {
  if (dataItem.dataContext.showBullets == true) {
    return am5.Bullet.new(root, {
      sprite: am5.Circle.new(root, {
        radius: 7,
        fill: series.get("fill")
      })
    });
  }
});
series.bullets.push(function(root, series, dataItem) {
  if (dataItem.dataContext.showBullets == true) {
    return am5.Bullet.new(root, {
      sprite: am5.Circle.new(root, {
        radius: 7,
        fill: series.get("fill")
      })
    });
  }
});
The demo below uses this approach to display a dot and a label on the last data item of the line series:
See the Pen Using templateField with bullets by amCharts team (@amcharts) on CodePen.
Multiple bullets
Series can contain any number of bullets. Each function pushed into bullets will create a separate bullet for each data item.
series.bullets.push(function(root) {
  return am5.Bullet.new(root, {
    locationX: 0.5,
    locationY: 0.5,
    sprite: am5.Circle.new(root, {
      radius: 15,
      fill: am5.color(0xffffff)
    })
  });
});

series.bullets.push(function(root) {
  return am5.Bullet.new(root, {
    locationX: 0.5,
    locationY: 0.5,
    sprite: am5.Label.new(root, {
      text: "{valueY}",
      centerX: am5.percent(50),
      centerY: am5.percent(50),
      populateText: true
    })
  });
});
series.bullets.push(function(root) {
  return am5.Bullet.new(root, {
    locationX: 0.5,
    locationY: 0.5,
    sprite: am5.Circle.new(root, {
      radius: 15,
      fill: am5.color(0xffffff)
    })
  });
});

series.bullets.push(function(root) {
  return am5.Bullet.new(root, {
    locationX: 0.5,
    locationY: 0.5,
    sprite: am5.Label.new(root, {
      text: "{valueY}",
      centerX: am5.percent(50),
      centerY: am5.percent(50),
      populateText: true
    })
  });
});
See the Pen Column series with label bullets by amCharts team (@amcharts) on CodePen.
Auto-hiding bullets
We can set up series to automatically hide its bullets if there are a lot of data points and bullets would just overcrowd the chart.
For that purpose, XY chart series has a setting minBulletDistance.
It's a numeric value which means this: if the distance between data items in series is less than X pixels, hide all bullets.
This setting is dynamic, and will react to changing conditions. I.e. when chart is zoomed in and distances between data items increase, hidden bullets may reappear.
Bullet masking
Normally, bullets are constrained to the plot area of the chart.
If some bullet or part of it goes outside, it's clipped.
To disable such clipping, set maskBullets to false in your series settings:
let series = chart.series.push(am5xy.ColumnSeries.new(root, {
  xAxis: xAxis,
  yAxis: yAxis,
  valueYField: field,
  valueXField: "date",
  maskBullets: false
}));
var series = chart.series.push(am5xy.ColumnSeries.new(root, {
  xAxis: xAxis,
  yAxis: yAxis,
  valueYField: field,
  valueXField: "date",
  maskBullets: false
}));
maskBullets: true (default)
maskBullets: falseSee the Pen Column series with multiple bullets by amCharts team (@amcharts) on CodePen.
MORE INFOFor more information on how to work around bullet masking and related issues, refer to "Handling bullet masking" tutorial.
Event handlers
Adding events
There is a couple of ways to attach event handlers to bullets:
- Creating a standalone template, adding event handlers to it, then using that template to create bullet sprite element.
- Attaching events to each sprite element in bullet function.
The following snippet adds a click event to a bullet using template:
let bulletTemplate = am5.Template.new({});

bulletTemplate.events.on("click", function(ev) {
  console.log("Clicked on a bullet!", ev.target);
});

series.bullets.push(function(root) {
  return am5.Bullet.new(root, {
    sprite: am5.Circle.new(root, {
      radius: 5,
      fill: series.get("fill")
    }, bulletTemplate)
  });
});
var bulletTemplate = am5.Template.new({});

bulletTemplate.events.on("click", function(ev) {
  console.log("Clicked on a bullet!", ev.target);
});

series.bullets.push(function(root) {
  return am5.Bullet.new(root, {
    sprite: am5.Circle.new(root, {
      radius: 5,
      fill: series.get("fill")
    }, bulletTemplate)
  });
});
And below is the snippet that will achieve the same behavior, albeit by attaching an event to each new bullet being created:
series.bullets.push(function(root) {
  const circle = am5.Circle.new(root, {
    radius: 5,
    fill: series.get("fill")
  });
  circle.events.on("click", function(ev) {
    console.log("Clicked on a bullet!", ev.target);
  });
  return am5.Bullet.new(root, {
    sprite: circle
  });
});
series.bullets.push(function(root) {
  var circle = am5.Circle.new(root, {
    radius: 5,
    fill: series.get("fill")
  });
  circle.events.on("click", function(ev) {
    console.log("Clicked on a bullet!", ev.target);
  });
  return am5.Bullet.new(root, {
    sprite: circle
  });
});
See the Pen Line series with bullets by amCharts team (@amcharts) on CodePen.
Events on series bullets
A series bullet event handler will contain all the information about target data item and series:
let bulletTemplate = am5.Template.new({});

bulletTemplate.events.on("click", function(ev) {
  // Bullet id
  console.log("Clicked on a column", ev.target.uid);

  // Data item
  console.log(ev.target.dataItem);

  // Original data object
  console.log(ev.target.dataItem.dataContext);

  // Series
  console.log(ev.target.dataItem.component)
});

series.bullets.push(function(root) {
  return am5.Bullet.new(root, {
    sprite: am5.Circle.new(root, {
      radius: 5,
      fill: series.get("fill")
    }, bulletTemplate)
  });
});
var bulletTemplate = am5.Template.new({});

bulletTemplate.events.on("click", function(ev) {
  // Bullet id
  console.log("Clicked on a column", ev.target.uid);

  // Data item
  console.log(ev.target.dataItem);

  // Original data object
  console.log(ev.target.dataItem.dataContext);

  // Series
  console.log(ev.target.dataItem.component)
});

series.bullets.push(function(root) {
  return am5.Bullet.new(root, {
    sprite: am5.Circle.new(root, {
      radius: 5,
      fill: series.get("fill")
    }, bulletTemplate)
  });
});
Removing series bullets
There are two steps to completely remove bullets from series:
- Clear series'
bulletsContainer. - Clear series'
bulletslist.
series.bulletsContainer.children.clear();
series.bullets.clear();
series.bulletsContainer.children.clear();
series.bullets.clear();
Related tutorials
- Axis range bullets
- Hide or relocate label bullets for small columns
- Triggering bullet hover with an XY cursor
- Totals on column stacks
- Totals on clustered column stacks
- Handling bullet masking
- Different bullet styling of grouped data items
- Solving overlapping bullets
- Complex bullets with hover effect
- Column labels as categories
- Map with custom markers and data-bound colors