This tutorial provides information on how to create Weighted Voronoi Treemaps.
Voronoi treemaps are a method of visualizing hierarchical data using Voronoi diagrams, where each cell represents a portion of the data and the hierarchy is encoded by the nesting of cells within each other.
Diagram shape
Type
Voronoi treemap can either take rectangular or polygon shape.
It's controlled by setting shapeType, with two possible values: "rectangle", and "polygon" (default).
let series = root.container.children.push(
  am5hierarchy.VoronoiTreemap.new(root, {
    valueField: "value",
    categoryField: "name",
    childDataField: "children",
    shapeType: "rectangle"
  })
);
var series = root.container.children.push(
  am5hierarchy.VoronoiTreemap.new(root, {
    valueField: "value",
    categoryField: "name",
    childDataField: "children",
    shapeType: "rectangle"
  })
);
| Setting value | Example |
|---|---|
"rectangle" | 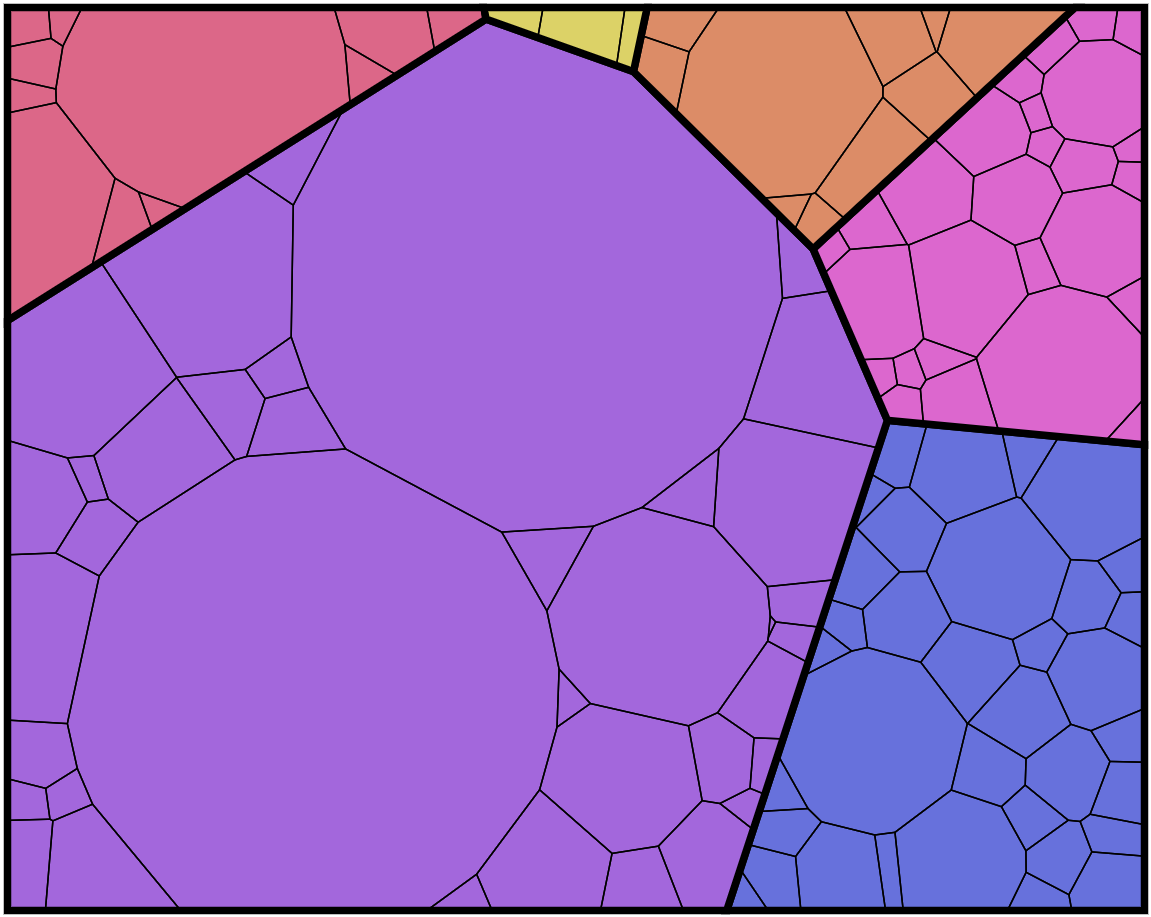 |
"polygon" | 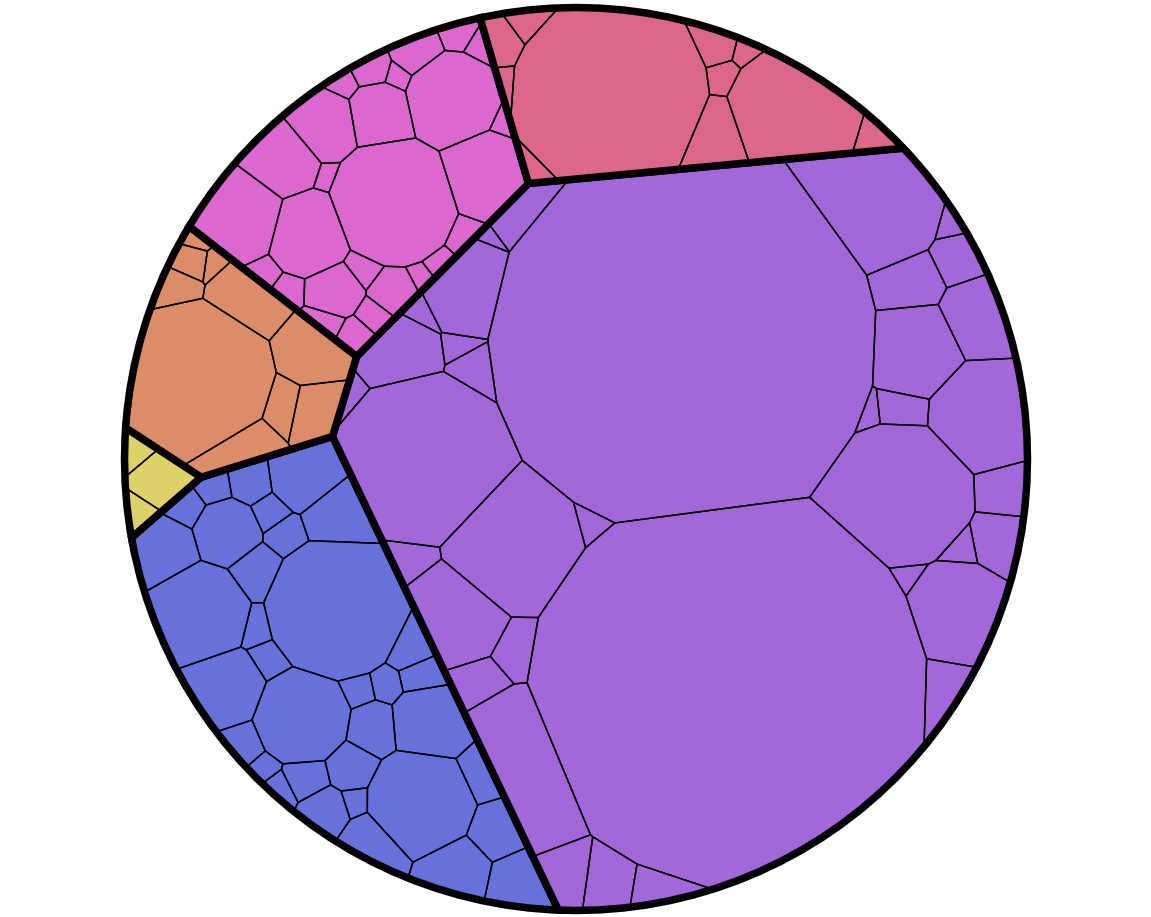 |
Corner count
For the "polygon" shape type, we can also control the shape by setting cornerCount setting.
The bigger the value, the more corners, the rounder the shape, with 120 (default) resulting in a perfect circle.
cornerCount: 120 (default)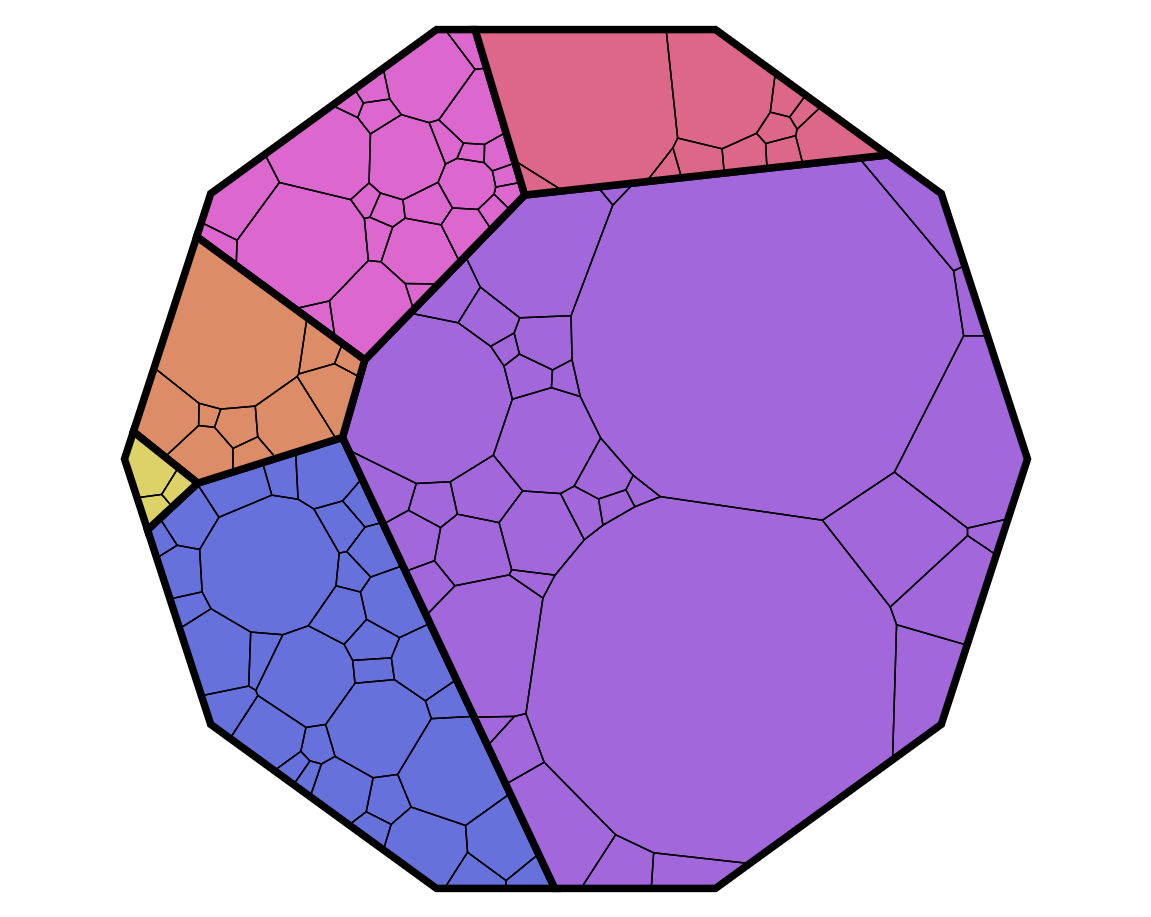
cornerCount: 10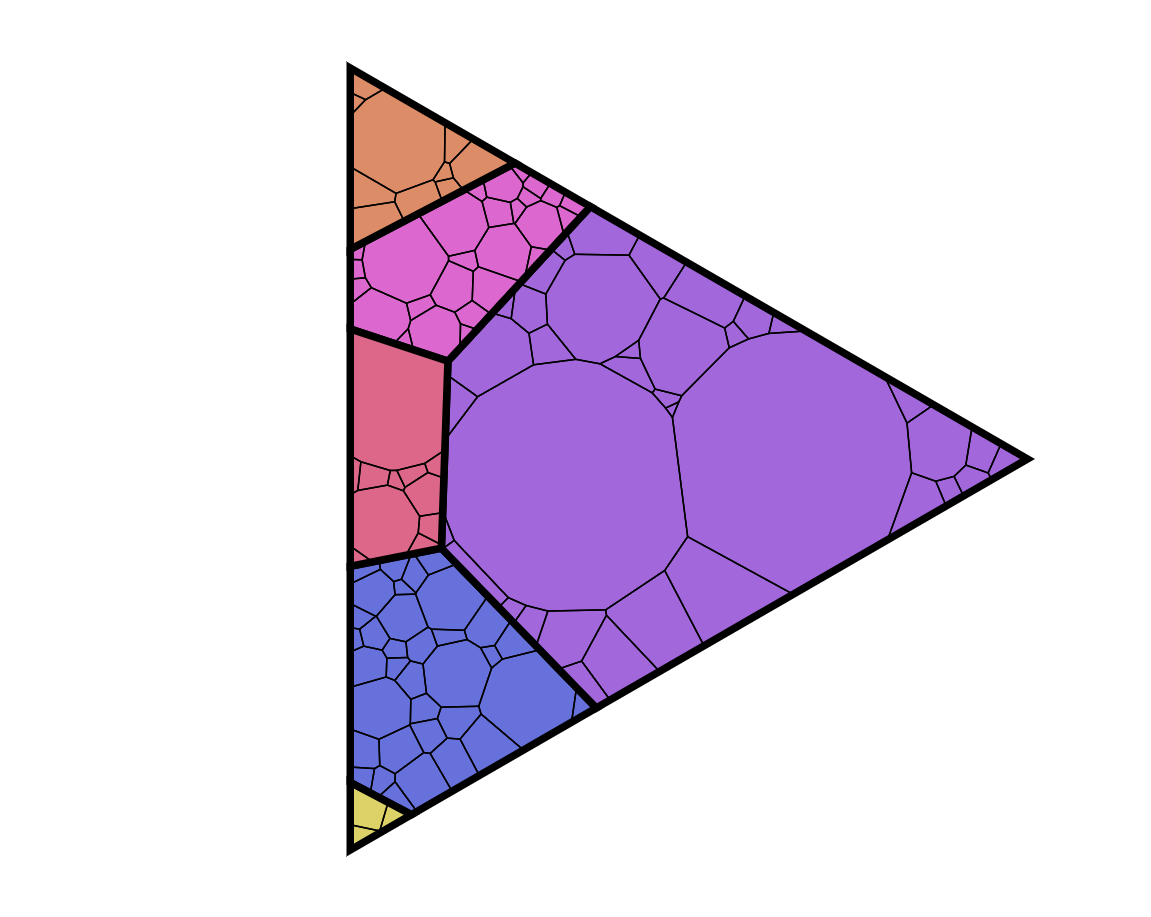
cornerCount: 3Nodes
Handling small nodes
In Voronoi treemap, nodes are sized relatively to their value (weight). However, the chart will not let the node get smaller than certain threshold, so each node has at leas minimal size.
The setting that controls it is minWeightRatio (default 0.005).
It means the fraction of the weight of the biggest node. As an example: if the biggest node has value of 1000, with minWeightRatio set at 0.005, the minimum weight will be 5, and small nodes will be drawn as having that value, even if their actual value is smaller than that.
NOTESince artificially scaling up small nodes distorts visual representation, it's best to avoid data with nodes in very big differences in values, and group small nodes into a single "Others" item.
Accuracy VS performance
There are also two other settings of the Voronoi treemap that can control calculations when sizing and laying out the nodes:
convergenceRatio(default:0.005)
The convergence ratio is calculated as the ratio of the summed area of the smallest enclosing rectangle for each cell to the total area of the treemap. A lower convergence ratio indicates a better representation of the hierarchy, meaning that the cells are closely packed and the treemap effectively captures the nested relationships between the data elements, but will also increase CPU load.maxIterationCount(default:100)
Maximum allowed number of iterations when computing the layout. Computation is stopped when it number of iterations is reached, even if theconvergenceRatiois not yet reached. The bigger number means finer results, but slower performance.
Node appearance
The appearance of node polygons can be configured using their template, accessible on series property: rectangles.polygons.
Those are an element of type Polygon.
series.polygons.template.setAll({
  stroke: am5.color(0x000000)
});
series.polygons.template.setAll({
  stroke: am5.color(0x000000)
});
Hover behavior
We can set setting values to apply to a rectangle when it is hovered by creating a "hover" state for it.
series.polygons.template.states.create("hover", {
  fill: am5.color(0x677935),
  fillOpacity: 1
});
series.polygons.template.states.create("hover", {
  fill: am5.color(0x677935),
  fillOpacity: 1
});
Labels
Configuring labels
Series label configuration is done via its template, accessible via series property labels.template.
series.labels.template.setAll({
  fontSize: 20,
  fill: am5.color(0x550000),
  text: "{category}"
});
series.labels.template.setAll({
  fontSize: 20,
  fill: am5.color(0x550000),
  text: "{category}"
});
Partition series uses Label for its labels. Check out its class reference for all the possible settings.
Label content
Node labels are pre-set to display name of the node (category).
We can modify contents of the tooltips using text setting on a series label template:
series.labels.template.setAll({
  text: "{category}: [bold]{sum}[/]",
  fontSize: 14
});
series.labels.template.setAll({
  text: "{category}: [bold]{sum}[/]",
  fontSize: 14
});
Contents of the tooltip can include data placeholders (codes in curly brackets that will be replaced by actual data) and in-line formatting blocks (formatting instructions enclosed in square brackets).
Disabling labels
To disable series labels, we can set forceHidden setting to true in their template:
series.labels.template.set("forceHidden", true);
series.labels.template.set("forceHidden", true);
Different settings based on level
It's possible target settings to nodes and labels at specific level of the hierarchy using custom themes.
The following code will hide all top- and first-level labels, as well as apply thicker outline to the first-level nodes:
let myTheme = am5.Theme.new(root);

myTheme.rule("Polygon", ["hierarchy", "node", "shape", "depth1"]).setAll({
  strokeWidth: 5
});

myTheme.rule("Label", ["node", "depth0"]).setAll({
  forceHidden: true
});

myTheme.rule("Label", ["node", "depth1"]).setAll({
  forceHidden: true
});

root.setThemes([
  am5themes_Animated.new(root),
  myTheme
]);
var myTheme = am5.Theme.new(root);

myTheme.rule("Polygon", ["hierarchy", "node", "shape", "depth1"]).setAll({
  strokeWidth: 5
});

myTheme.rule("Label", ["node", "depth0"]).setAll({
  forceHidden: true
});

myTheme.rule("Label", ["node", "depth1"]).setAll({
  forceHidden: true
});

root.setThemes([
  am5themes_Animated.new(root),
  myTheme
]);
Basically, we can target elements using "depth*" tag in theme selectors.
Tooltips
Nodes are pre-set to display a tooltip on hover containing name of the node and its value.
We can modify contents of the tooltips using tooltipText on node's template:
series.nodes.template.set("tooltipText", "{category}: [bold]{sum}[/]");
series.nodes.template.set("tooltipText", "{category}: [bold]{sum}[/]");
Contents of the tooltip can include data placeholders (codes in curly brackets that will be replaced by actual data) and in-line formatting blocks (formatting instructions enclosed in square brackets).
Example
See the Pen Round Voronoi Treemap by amCharts team (@amcharts) on CodePen.