This tutorial will show how we can use Slice Grouper plugin to automatically group small slices.
Purpose
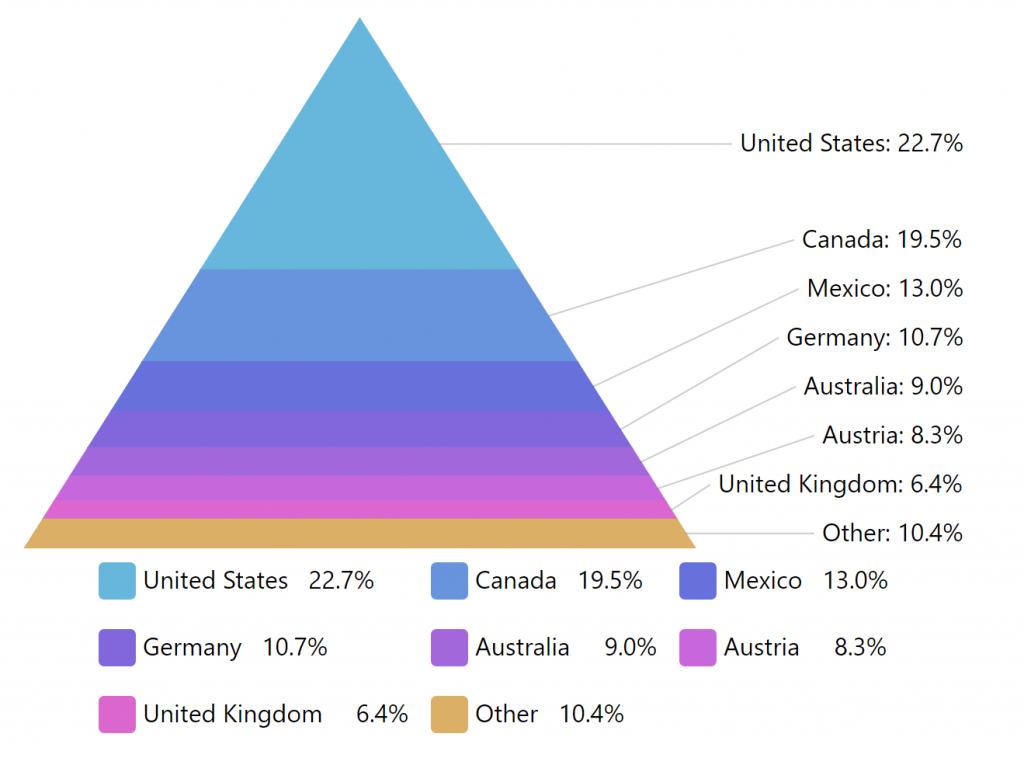
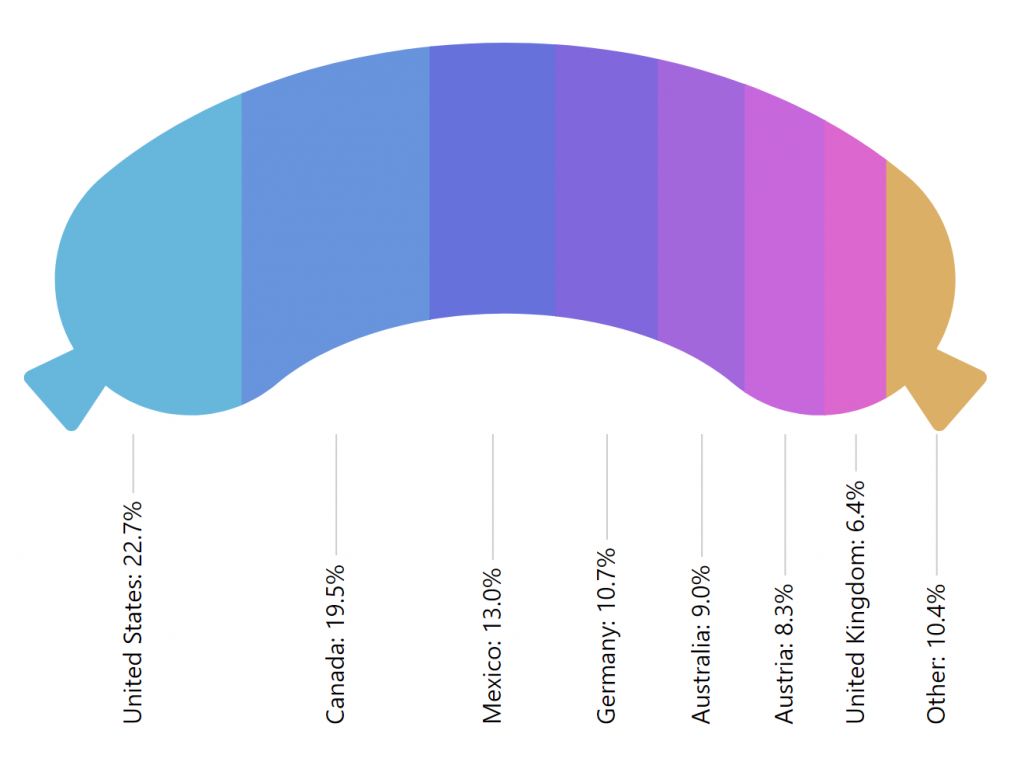
"Percent" charts such as Pie, Funnel, Pyramid, or Pictorial Stacked depict each data item as a relatively-sized "slice". The smaller the slice's value in comparison to other slices, the smaller the slice itself.
While this provide proportional information prominent, some relatively small slices, might be insignificant for conveying the "big picture, and contribute to the noise.
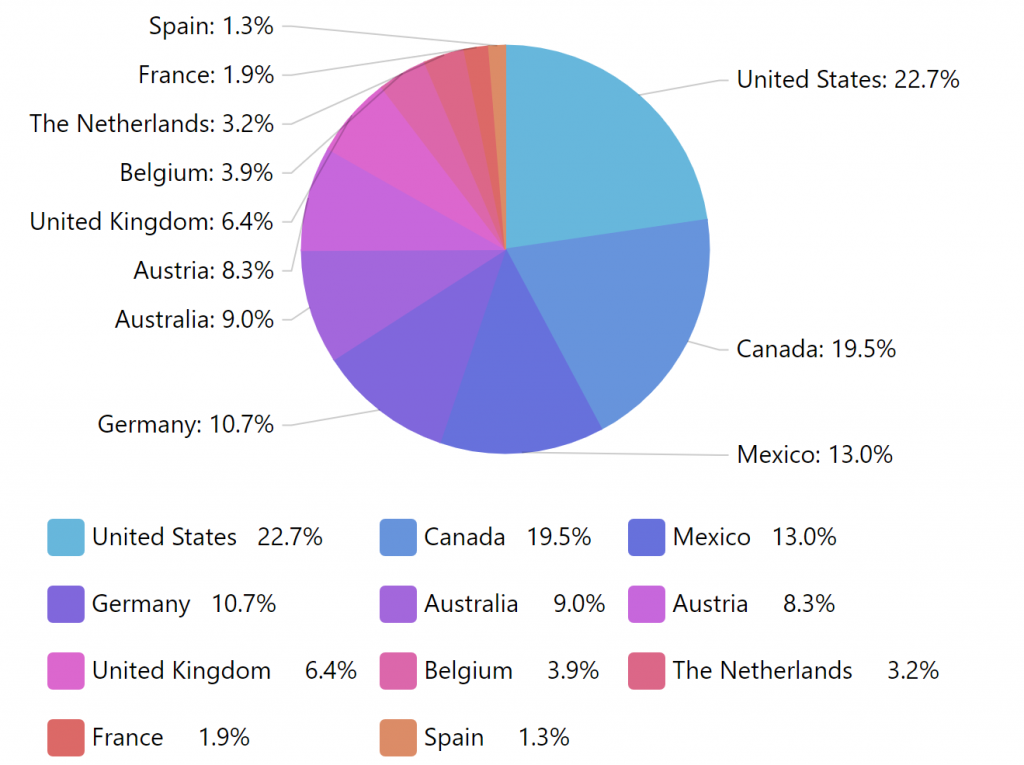
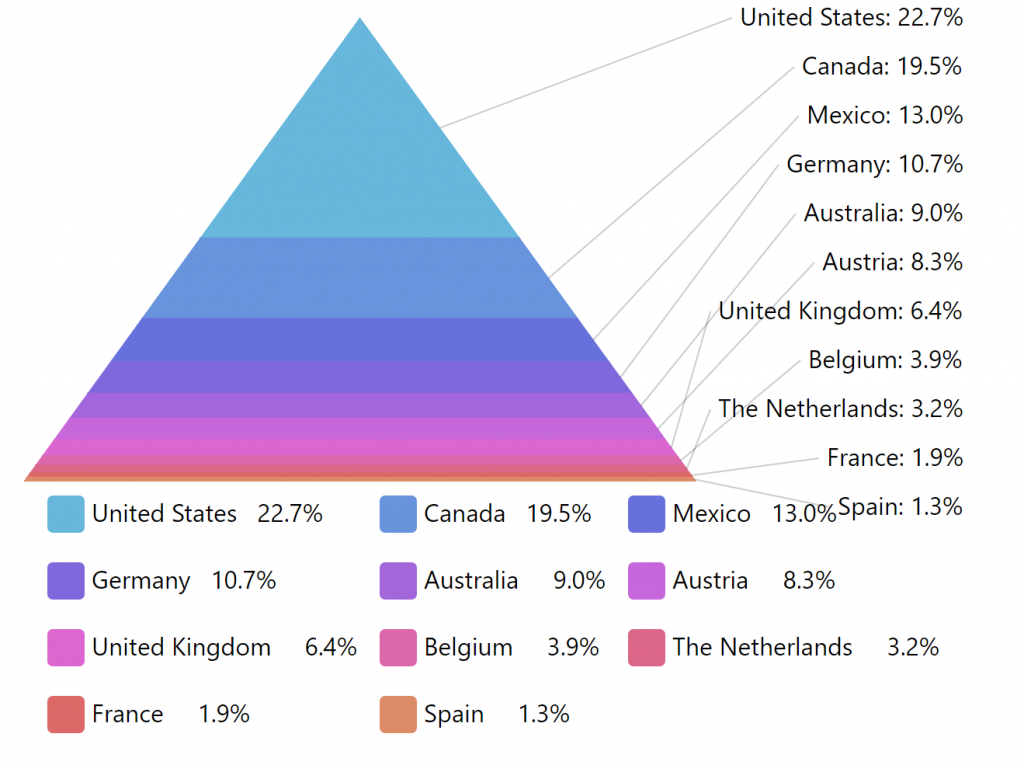
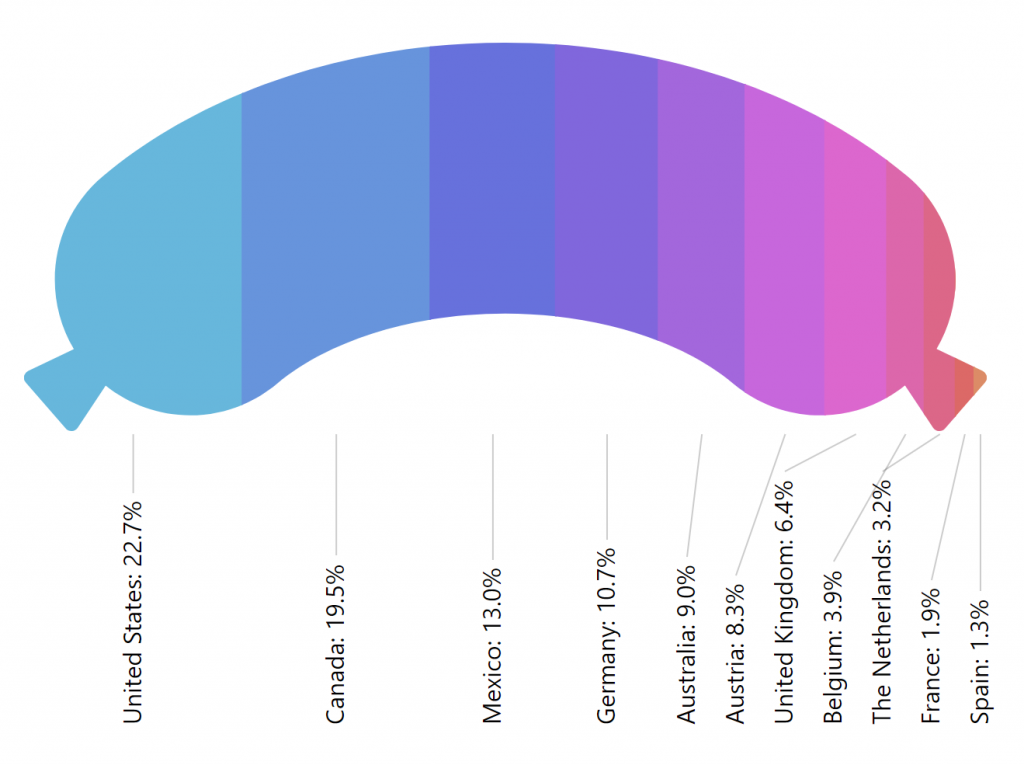
What a clutter!
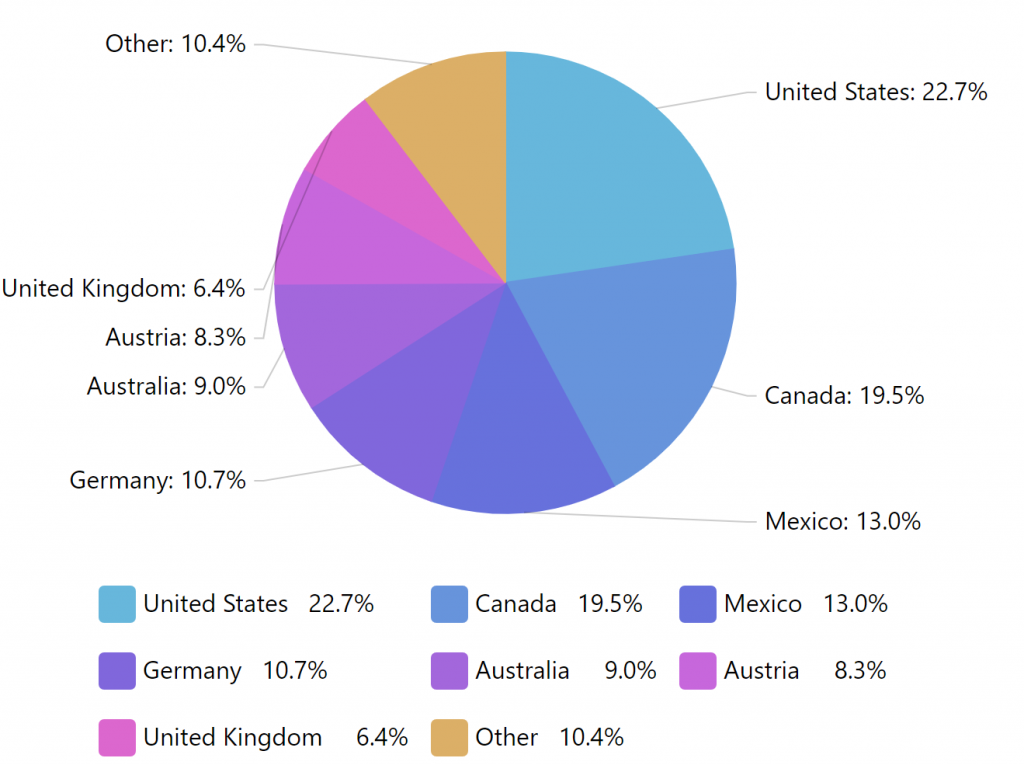
If we examine the charts closer, we'll see that the last four items have their own place, label and even legend item that take up space, even though their collective value barely comprises 10% of the whole chart.
The purpose of SliceGrouper plugin is to automatically group those slices like that into a single "Other" slice.
Loading
Slice grouper plugin needs to be loaded in order for it to be used.
You can import those in your TypeScript / ES6 application as JavaScript modules:
import * as am5plugins_sliceGrouper from "@amcharts/amcharts5/plugins/sliceGrouper";
For vanilla JavaScript applications and web pages, you can use "script" version:
<script src="https://cdn.amcharts.com/lib/5/plugins/sliceGrouper.js"></script>
MORE INFOFor more information on installing amCharts 5 as well as loading modules refer to our "Getting started" tutorial.
Enabling
Slice grouper plugin is instantiated just like any other object in amCharts 5: by calling new() method of its class, passing in root element and settings object.
let grouper = am5plugins_sliceGrouper.SliceGrouper.new(root, {
});
var grouper = am5plugins_sliceGrouper.SliceGrouper.new(root, {
});
Setting up
Available settings
Plugin is configured via its instances settings:
| Setting | Type | Default | Comment |
clickBehavior | "none" | "break" | "zoom" | "none" | What happens when you click on "Other" slice? See "Click behavior" section below. |
groupName | string | "Other" | Name of the group slice. |
limit | number | If set, only first X slices will be left alone (regardless of their value and threshold setting), the rest will be grouped into "Other" slice. | |
legend | Legend | Target legend. | |
series | PercentSeries | Target series. | |
threshold | number | 5 | Slices that comprise this percent or less of the total will be grouped into "Other" slice. |
For plugin to work, we need to at least set its series setting. It needs to be a reference to the series, which we want to group slices in, e.g. a PieSeries.
let grouper = am5plugins_sliceGrouper.SliceGrouper.new(root, {
  series: pieSeries
});
var grouper = am5plugins_sliceGrouper.SliceGrouper.new(root, {
  series: pieSeries
});
Group thresholds
The plugin will automatically group all slices that are less than 5% into a single slice.
We can change this value via threshold setting, which accepts numeric values.
There's also a limit setting. It also accepts a numeric value which means number of first slices to leave as they are, automatically grouping the rest.
Both of the setting scan be combined and used together:
let grouper = am5plugins_sliceGrouper.SliceGrouper.new(root, {
  series: pieSeries,
  threshold: 10,
  limit: 5
});
var grouper = am5plugins_sliceGrouper.SliceGrouper.new(root, {
  series: pieSeries,
  threshold: 10,
  limit: 5
});
Click behavior
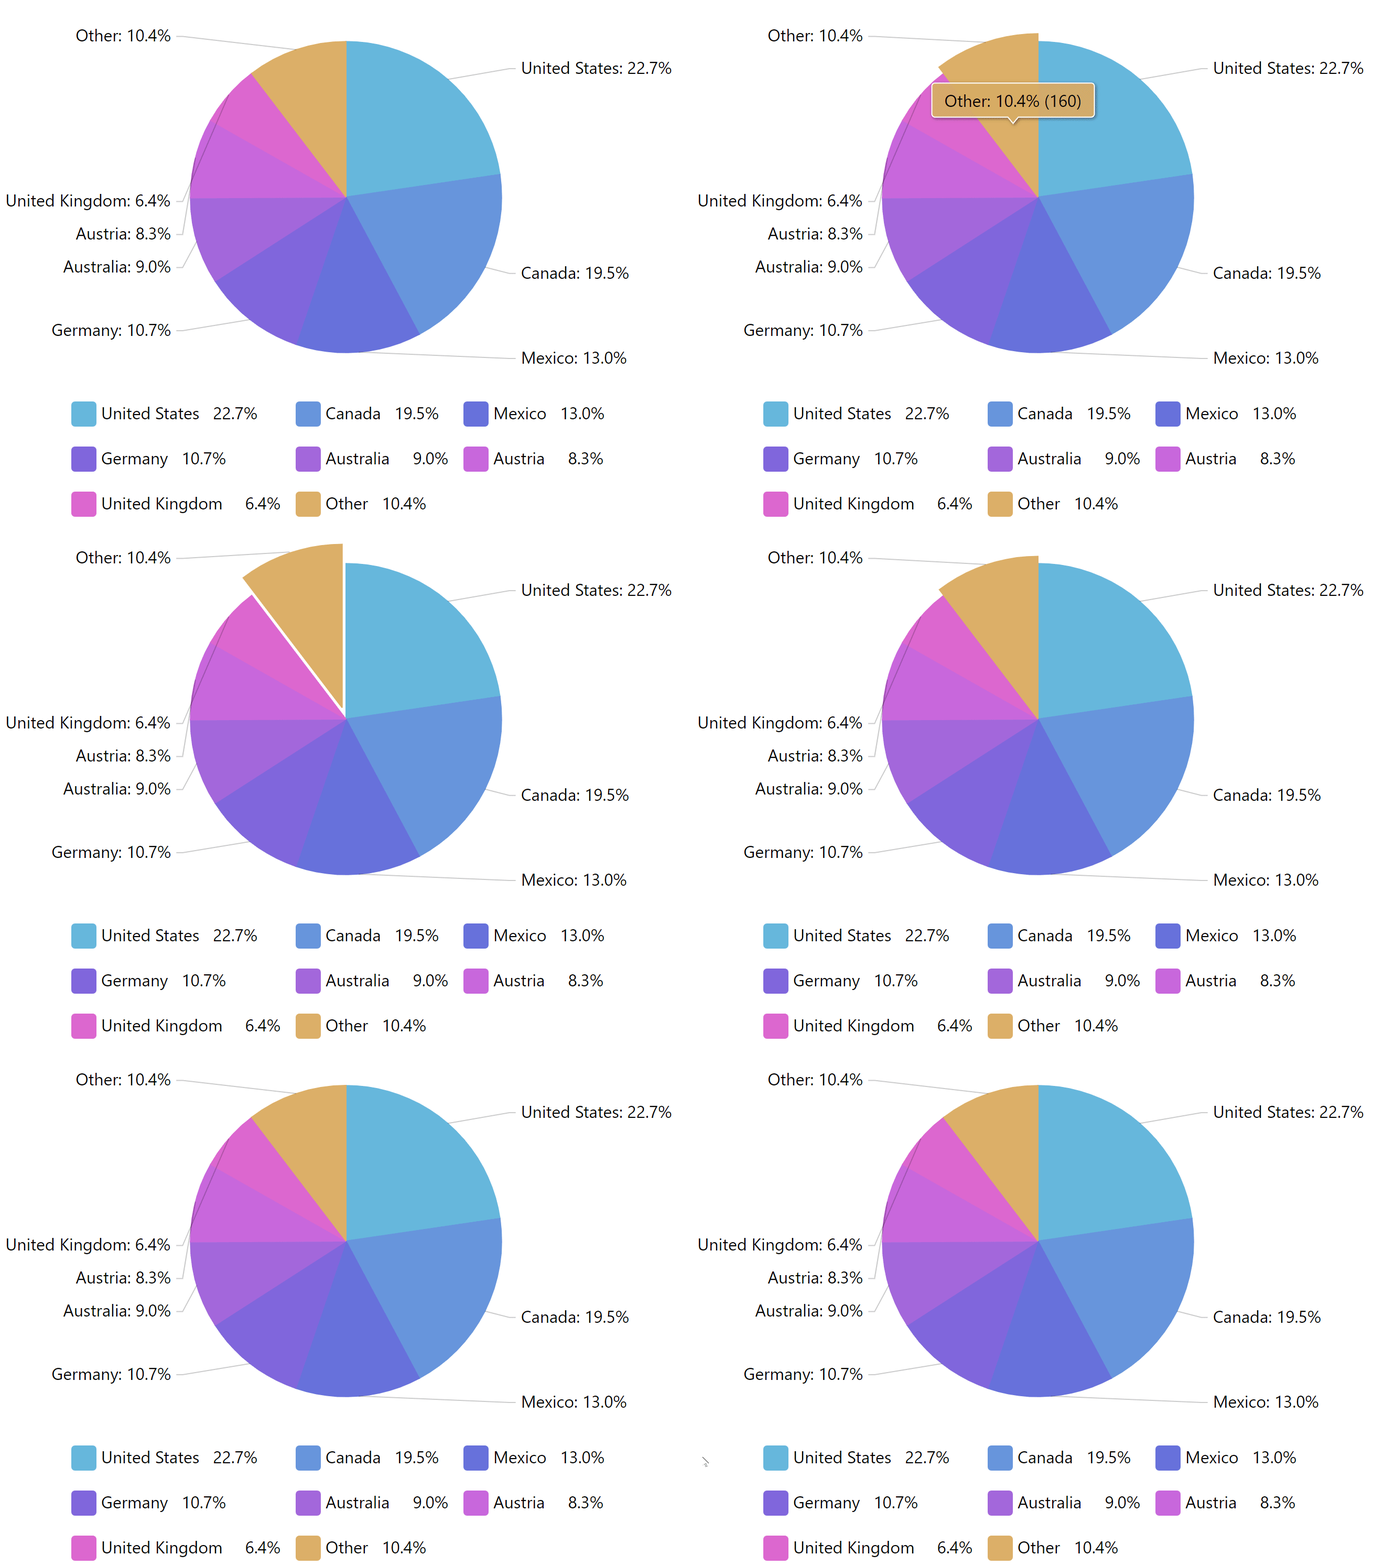
By default, the "Other" slice acts like any other slice on the chart. For example, on a Pie Chart it would pull it out on click or tap.
We can use clickBehavior to alter this functionality.
Setting it to "break" will hide "Other" slice and will reveal actual small slices that comprise it instead. A "Zoom out" button will be shown that would allow collapsing small slices back into their group slice.
"zoom" setting will act similarly, except big slices will be hidden as well, in order for us to be able to concentrate on the actual relation between small slices.
clickBehavior: "none" (default)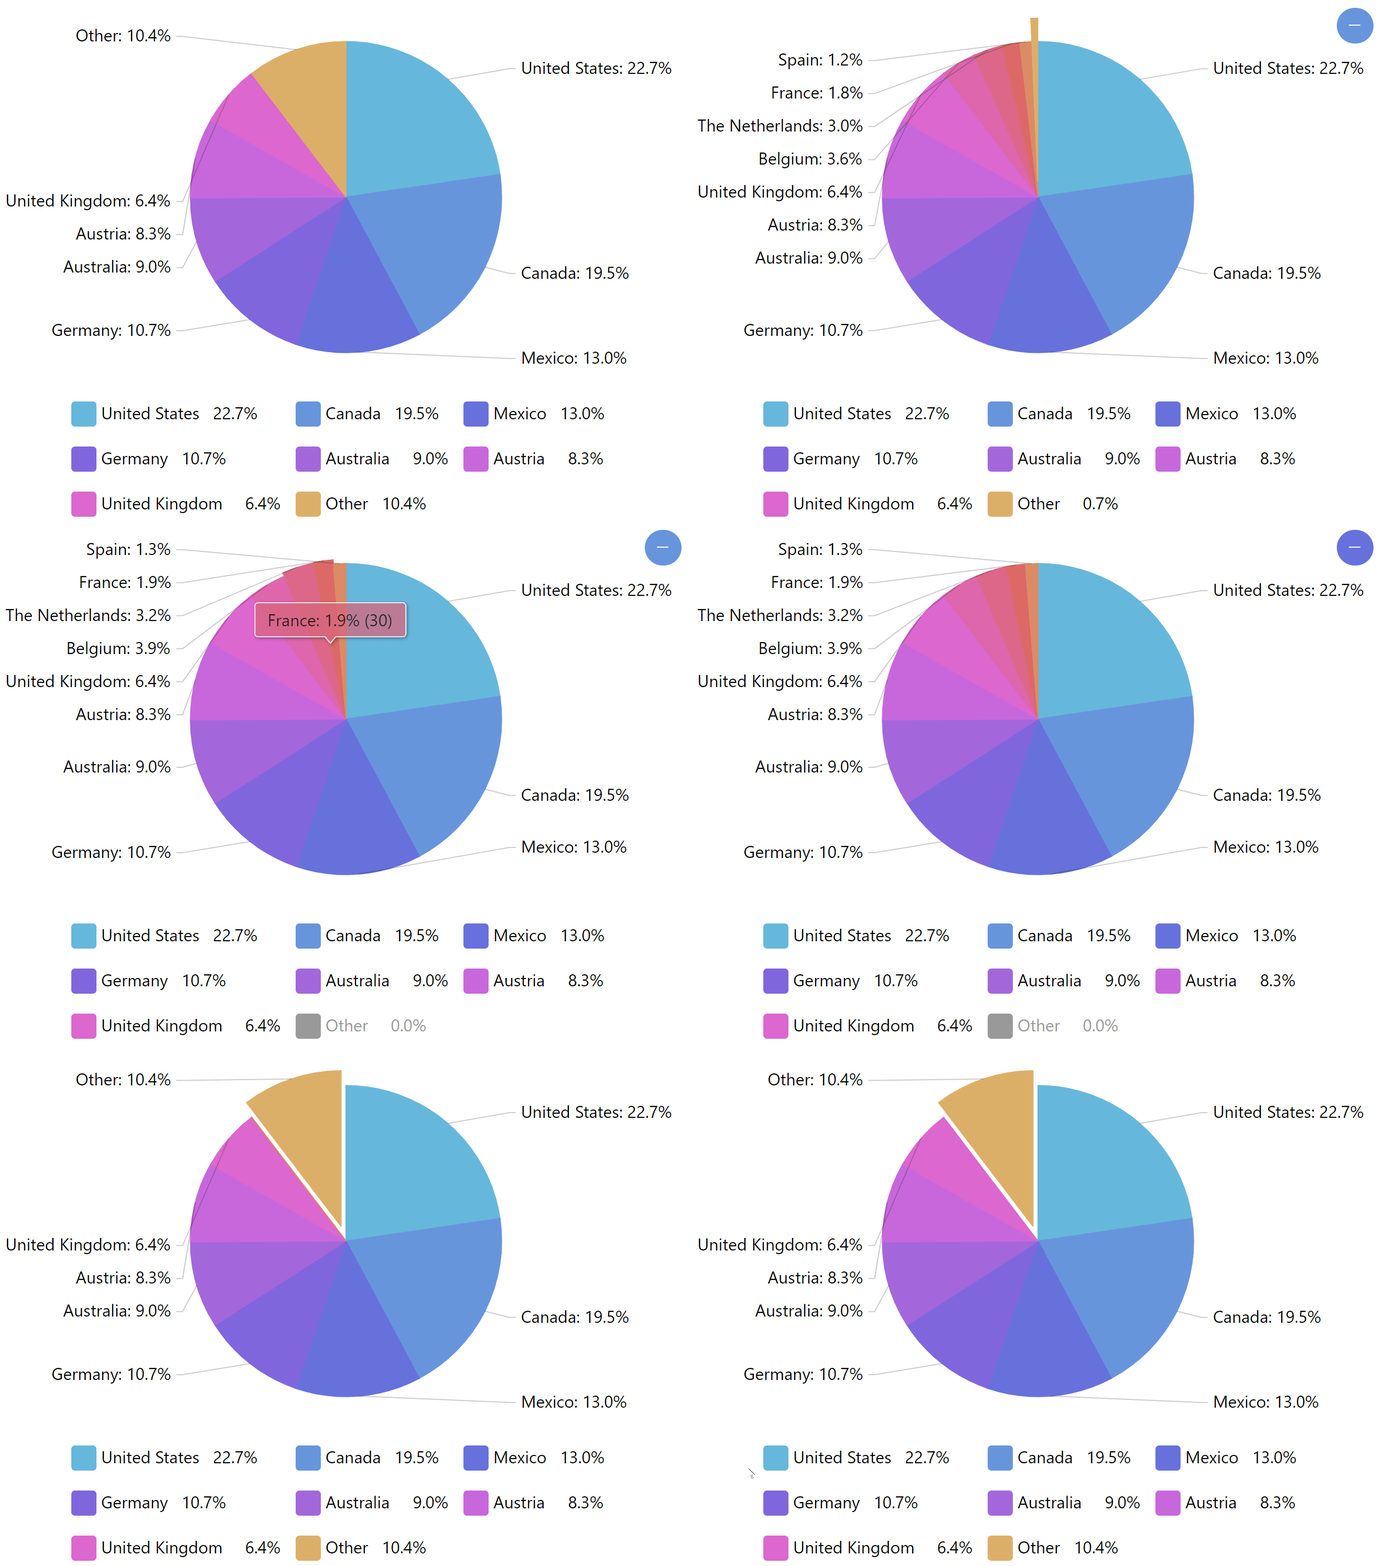
clickBehavior: "break"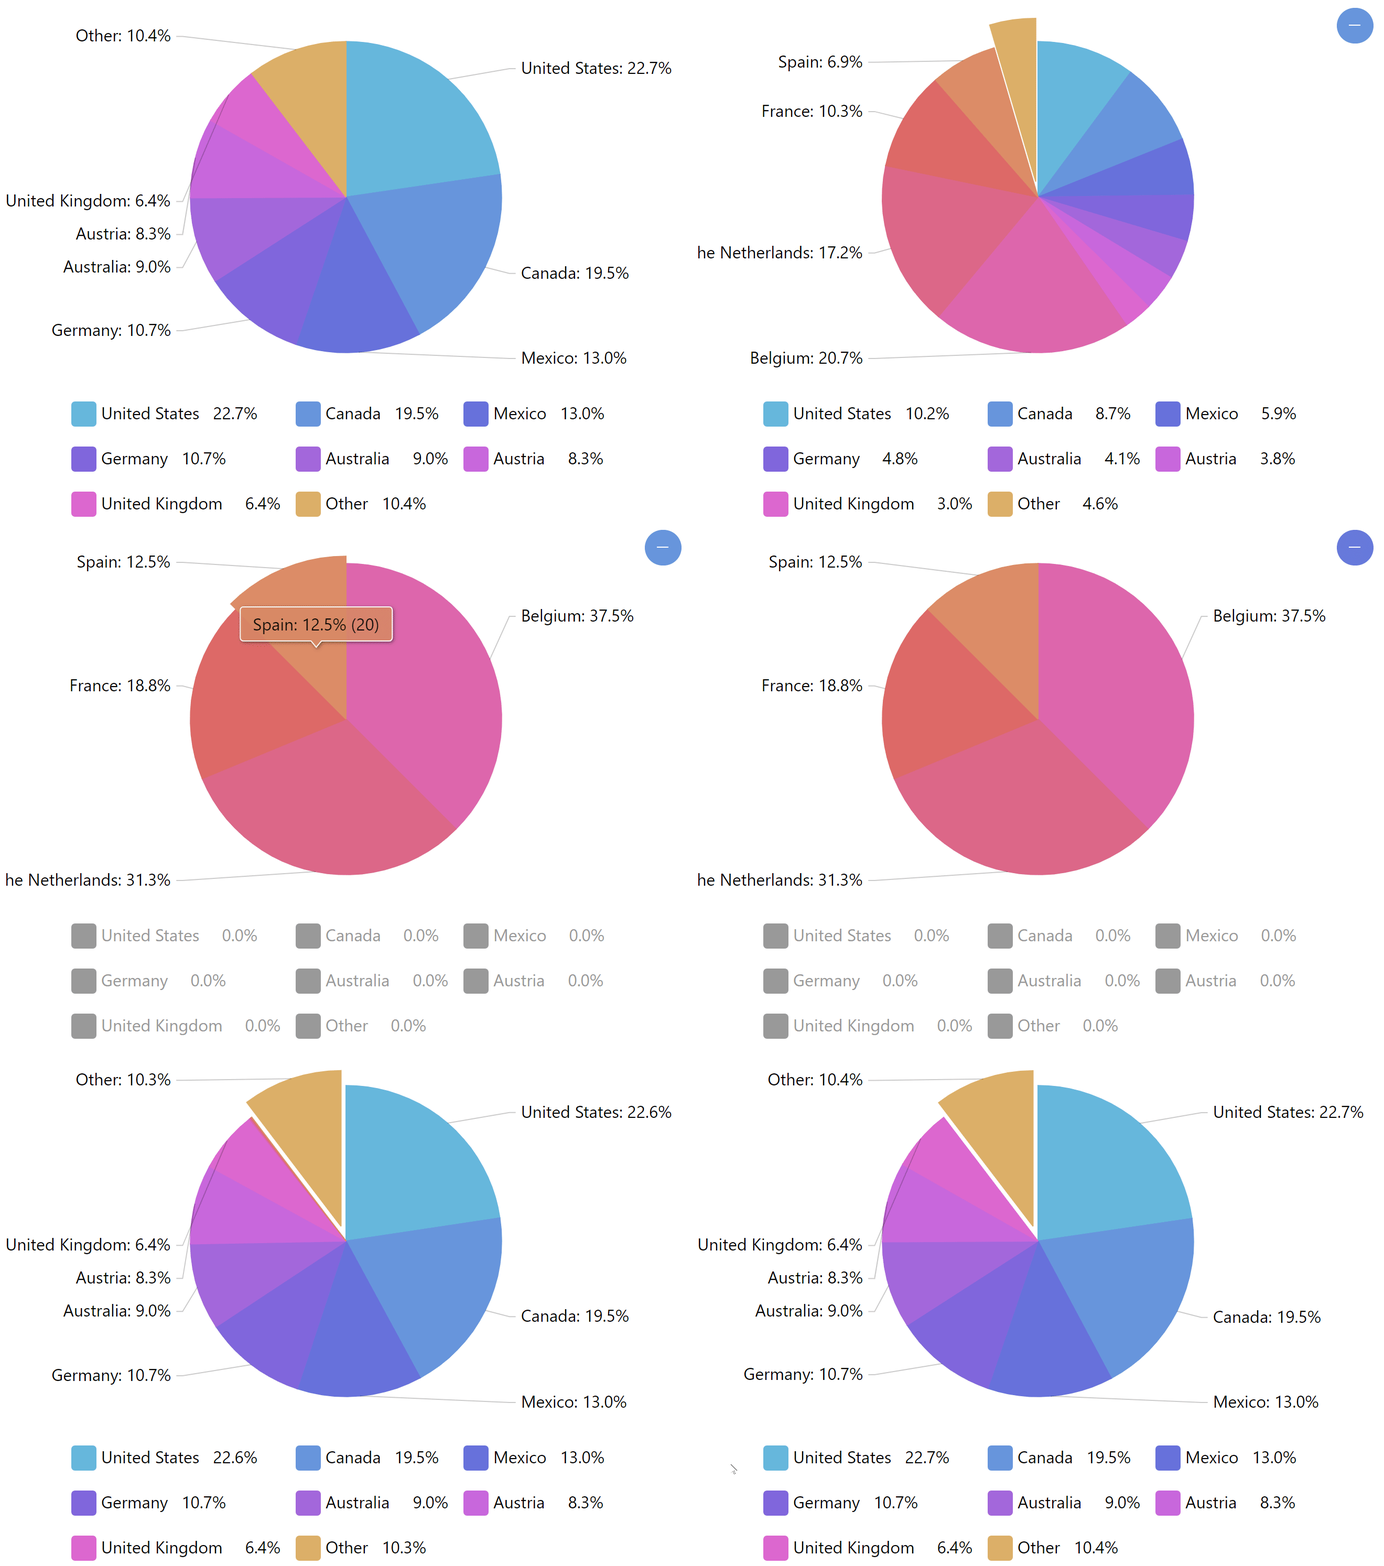
clickBehavior: "zoom"Legend
If our chart uses a legend, and we want plugin to automatically hide legend items for hidden slices, we need to set legend setting as well:
let grouper = am5plugins_sliceGrouper.SliceGrouper.new(root, {
  series: pieSeries,
  legend: legend
});
var grouper = am5plugins_sliceGrouper.SliceGrouper.new(root, {
  series: pieSeries,
  legend: legend
});
Examples
Here's a basic Pie chart with grouped slices.
See the Pen Untitled by amCharts team (@amcharts) on CodePen.
Here's another one, which users adapter to break down grouped slice info in the tooltip of the "Other" slice:
See the Pen Slice grouper with breakdown of the "Other" slice in a tooltip by amCharts team (@amcharts) on CodePen.