This tutorial looks at how we can create gradients to use for element fills ant outlines.
To apply a gradient fill to an element, we need to do two things:
- Create a gradient object.
- Assign it to element's
fillGradientand/orstrokeGradient.
Creating a gradient
Gradient object is created using its new() method:
let gradient = am5.LinearGradient.new(root, {
  stops: [{
    color: am5.color(0xFF621F)
  }, {
    color: am5.color(0x946B49)
  }]
});
var gradient = am5.LinearGradient.new(root, {
  stops: [{
    color: am5.color(0xFF621F)
  }, {
    color: am5.color(0x946B49)
  }]
});
Available gradient types
| Pattern class | Example |
|---|---|
LinearGradient |  |
RadialGradient |  |
Setting gradient
To set a gradient fill on an element, we need to assign it to element's fillGradient setting.
Similarly, to assign it to element's stroke (line), we can use strokeGradient.
columnSeries.columns.template.set("fillGradient", am5.LinearGradient.new(root, {
  stops: [{
    color: am5.color(0xFF621F)
  }, {
    color: am5.color(0x946B49)
  }],
  rotation: 90
}));
columnSeries.columns.template.set("fillGradient", am5.LinearGradient.new(root, {
  stops: [{
    color: am5.color(0xFF621F)
  }, {
    color: am5.color(0x946B49)
  }],
  rotation: 90
}));
Gradient stops
Each step in gradient is called a "stop".
Gradient needs to have two or more stops.
Those are set via gradient's stops setting which is an array of IGradientStop objects.
Colors
To set a color for the step, we a color property.
If color is not set, the gradient will try to reuse a color of the target element.
columnSeries.columns.template.set("fillGradient", am5.LinearGradient.new(root, {
  stops: [{
    color: am5.color(0xff621f)
  }, {
    color: am5.color(0x946b49)
  }]
}));
columnSeries.columns.template.set("fillGradient", am5.LinearGradient.new(root, {
  stops: [{
    color: am5.color(0xff621f)
  }, {
    color: am5.color(0x946b49)
  }]
}));
The whole area of the target element that needs to be filled will be divided between stops.
Gradient will start at the color of the first stop, then progress to the intermediate stop colors, and end with the color of the last stop.


See the Pen Patterns by amCharts team (@amcharts) on CodePen.
Opacity
Each step can also specify opacity. This allows creating transitions not only between color, but also opacities:
columnSeries.columns.template.set("fillGradient", am5.LinearGradient.new(root, {
  stops: [{
    color: am5.color(0xff621f),
    opacity: 1
  }, {
    color: am5.color(0x946b49),
    opacity: 0.2
  }]
}));
columnSeries.columns.template.set("fillGradient", am5.LinearGradient.new(root, {
  stops: [{
    color: am5.color(0xff621f),
    opacity: 1
  }, {
    color: am5.color(0x946b49),
    opacity: 0.2
  }]
}));
The above will make column fill start at color #946b49 fully opaque and end in #946b49 at 20% opacity.
color attribute is optional, so we can omit it and just set opacities. This will make gradient use target elements color, but apply different opacities to it.
Here's an example of such fill on a line series:
lineSeries.fills.template.set("fillGradient", am5.LinearGradient.new(root, {
  stops: [{
    opacity: 1
  }, {
    opacity: 0.5
  }]
}));
lineSeries.fills.template.set("fillGradient", am5.LinearGradient.new(root, {
  stops: [{
    opacity: 1
  }, {
    opacity: 0.5
  }]
}));
See the Pen Gradients with line series by amCharts team (@amcharts) on CodePen.
Brightness
Just like each step can modify color opacity, it can also brighten or darken color.
There are two step properties for that: lighten and brighten.
Both accept numeric values (0-1), that mean how to make color lighter/brighter (positive number) or dimmer/darker (negative number).
The difference between the two are subtle: lighten is basically a saturation control, keeping same gamma of color, whereas brighten controls actual vividness of the color. Increasing brightness makes color visually brighter, whereas increasing lightness makes it just closer to white.
lineSeries.fills.template.set("fillGradient", am5.LinearGradient.new(root, {
  stops: [{
    opacity: 1
  }, {
    opacity: 0.5
  }]
}));
lineSeries.fills.template.set("fillGradient", am5.LinearGradient.new(root, {
  stops: [{
    brighten: 1
  }, {
    brighten: -0.5
  }]
}));
The below two fills use the same color as a base


brighten: 1, brighten: -0.2
lighten: 1, lighten: -0.2 See the Pen Gradients by amCharts team (@amcharts) on CodePen.
Offsets
Normally, the stops will divvy up the whole space equally between them.
For example if there are 3 stops, there transition between 1st and 2nd stop will take up 50% of the space, and transition between 2n to 3rd another 50%.
We can use stop's offset property to change that.
offset accepts numeric value from 0 (zero) to 1 (one), indicating relative distance to area of the fill.
columnSeries.columns.template.set("fillGradient", am5.LinearGradient.new(root, {
  stops: [{
    color: am5.color(0x297373),
    offset: 0.7
  }, {
    color: am5.color(0x946b49)
  }],
  rotation: 90
}));
columnSeries.columns.template.set("fillGradient", am5.LinearGradient.new(root, {
  stops: [{
    color: am5.color(0x297373),
    offset: 0.7
  }, {
    color: am5.color(0x946b49)
  }],
  rotation: 90
}));
The above will make the first color to start at 70%, leaving only 30% for the actual gradient to second stop's color.

offset: 0 (default)
offset: 0.7Sizing
Normally, gradient will start and end at the edges of the target element.
In some cases we might need it to size differently.
For example, we if we set gradient fill on a LineSeries it will be start at the top point and will end at the lowest point.
Similarly, on a ColumnSeries each individual column will have differently sized gradient because of their varying height.
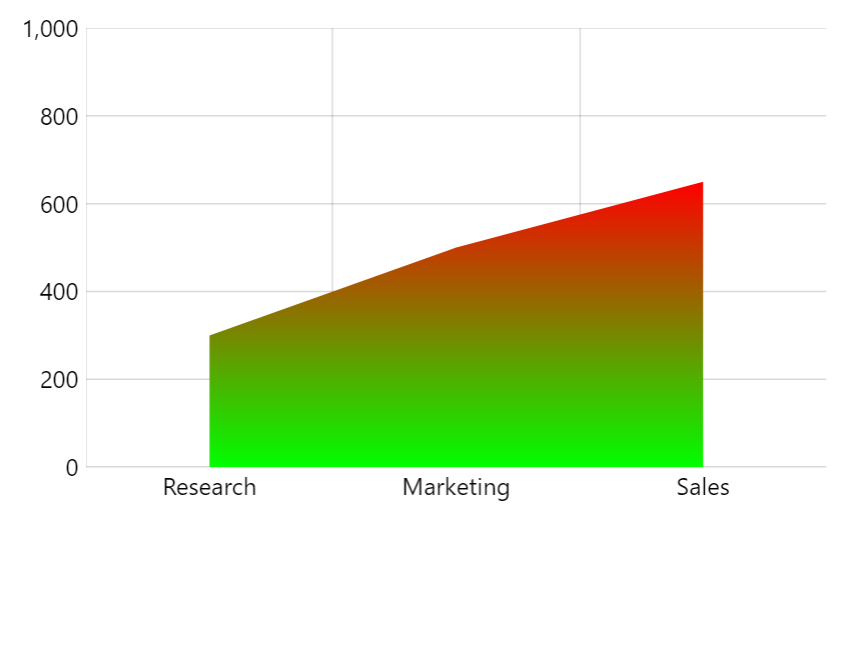
But we might want to apply gradient based on axis scale. That's where gradient's target setting comes in.
We can set it to any other element on the chart, for example chart.plotContainer:
columnSeries.columns.template.set("fillGradient", am5.LinearGradient.new(root, {
  stops: [{
    color: am5.color(0x297373)
  }, {
    color: am5.color(0x946b49)
  }],
  rotation: 90,
  target: chart.plotContainer
}));
columnSeries.columns.template.set("fillGradient", am5.LinearGradient.new(root, {
  stops: [{
    color: am5.color(0x297373),
    offset: 0.7
  }, {
    color: am5.color(0x946b49)
  }],
  rotation: 90,
  target: chart.plotContainer
}));
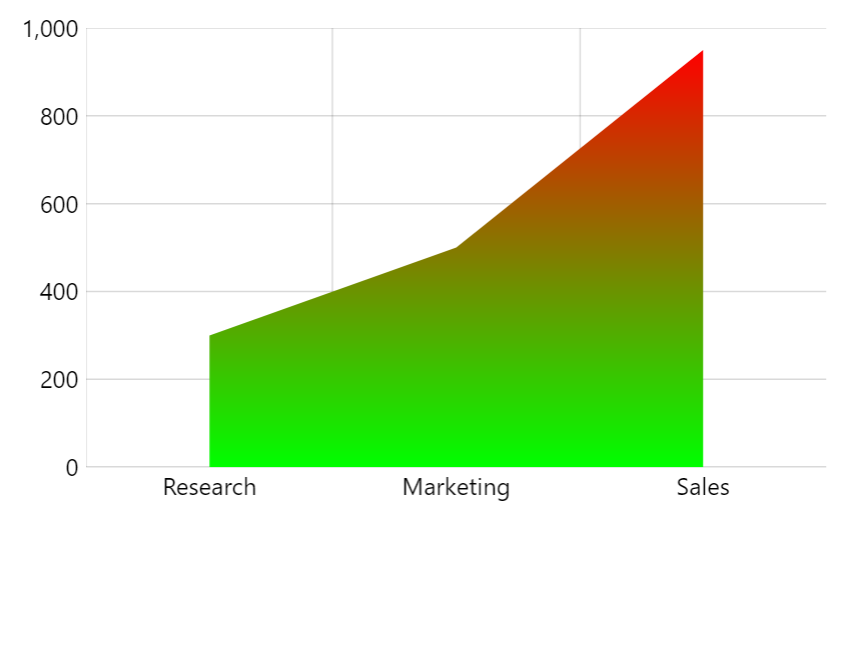
Now the gradient will be applied using sizing of the chart's plot container, rather than individual sizing of each series element.
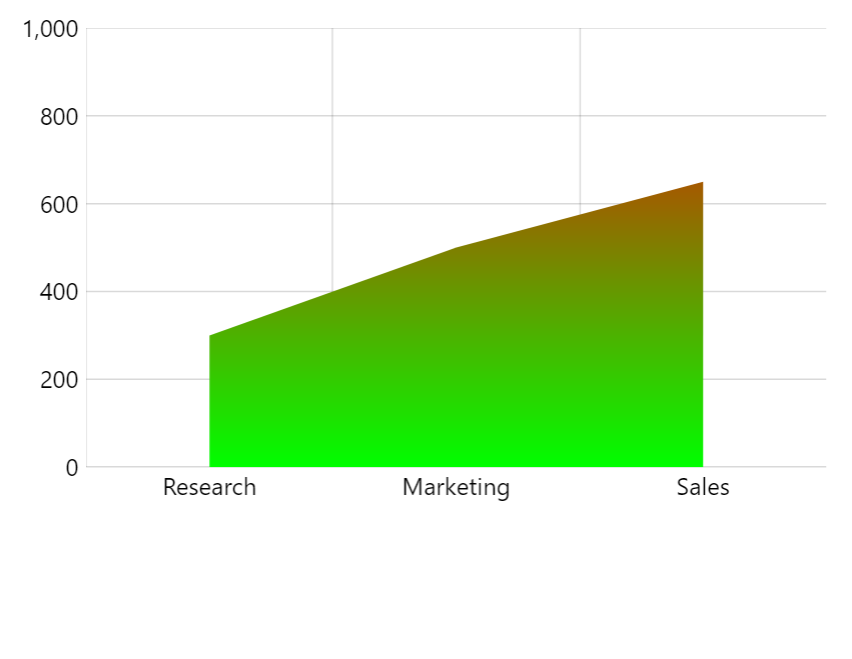
target: chart.plotContainer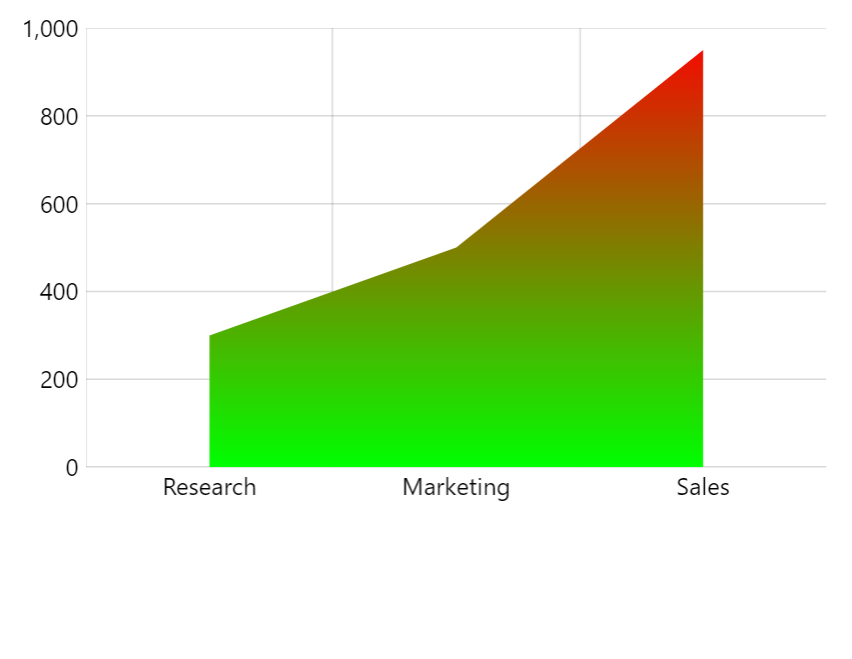
target: chart.plotContainer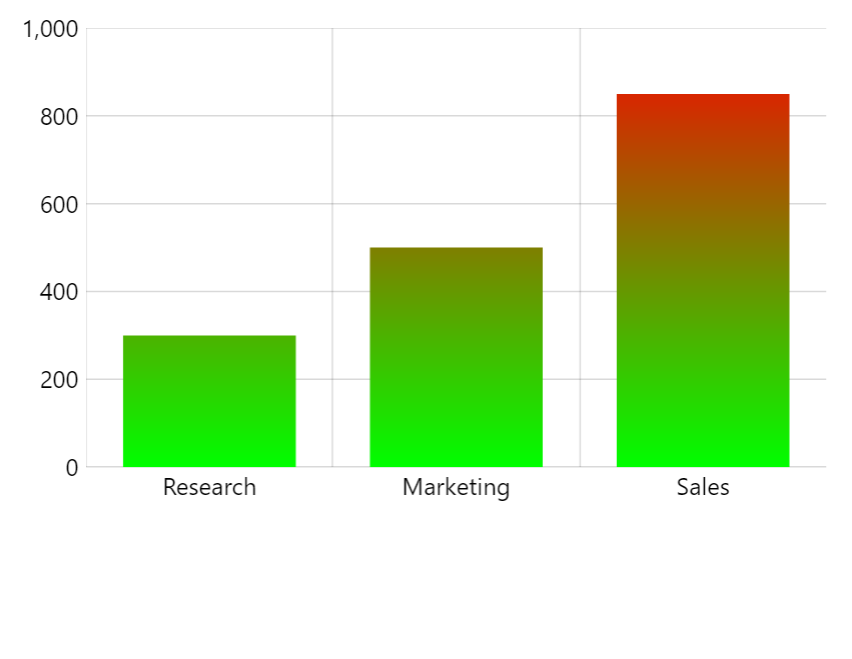
target: chart.plotContainerSee the Pen Gradients by amCharts team (@amcharts) on CodePen.
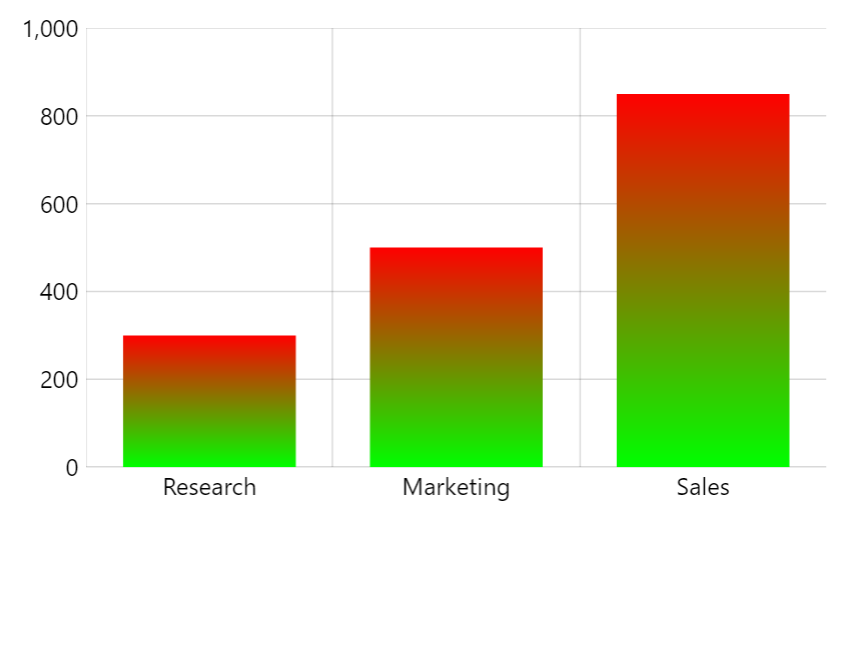
Rotation
Linear gradient has a property rotation which can be used to set direction of the gradient:
0- horizontal.90- vertical.45- diagonal.
columnSeries.columns.template.set("fillGradient", am5.LinearGradient.new(root, {
  stops: [{
    color: am5.color(0x297373)
  }, {
    color: am5.color(0x946b49)
  }],
  rotation: 90
}));
columnSeries.columns.template.set("fillGradient", am5.LinearGradient.new(root, {
  stops: [{
    color: am5.color(0x297373),
    offset: 0.7
  }, {
    color: am5.color(0x946b49)
  }],
  rotation: 90
}));

rotation: 0
rotation: 90Examples
Radial 3D effect
We can use 5-step gradient with just brighten values, to produce a 3D "shine" effect on a pie series:
pieSeries.slices.template.set("fillGradient", am5.RadialGradient.new(root, {
  stops: [{
    brighten: -0.8
  }, {
    brighten: -0.8
  }, {
    brighten: -0.5
  }, {
    brighten: 0
  }, {
    brighten: -0.5
  }]
}));
pieSeries.slices.template.set("fillGradient", am5.RadialGradient.new(root, {
  stops: [{
    brighten: -0.8
  }, {
    brighten: -0.8
  }, {
    brighten: -0.5
  }, {
    brighten: 0
  }, {
    brighten: -0.5
  }]
}));
See the Pen Pie chart with inner radius (donut) by amCharts team (@amcharts) on CodePen.