This tutorial will walk through common steps of creating sliced charts with funnel, pyramid, and pictorial stacked series.
Loading required modules
Everything required to create percent charts are two amCharts 5 modules: "index" and "percent".
You can import those in your TypeScript / ES6 application as JavaScript modules:
import * as am5 from "@amcharts/amcharts5";
import * as am5percent from "@amcharts/amcharts5/percent";
For vanilla JavaScript applications and web pages, you can use "script" version:
<script src="https://cdn.amcharts.com/lib/5/index.js"></script>
<script src="https://cdn.amcharts.com/lib/5/percent.js"></script>
MORE INFO For more information on installing amCharts 5 as well as loading modules refer to our "Getting started" tutorial.
Instantiating the chart
As with any chart type in amCharts 5, we'll need to start with creation of the Root element.
In it we will create an instance of SliceChart class to create a pie chart
let root = am5.Root.new("chartdiv");
let chart = root.container.children.push(
  am5percent.SlicedChart.new(root, {})
);
var root = am5.Root.new("chartdiv");
var chart = root.container.children.push(
  am5percent.SlicedChart.new(root, {})
);
MORE INFO The notion of creating class instances using .new() method is described in "Creating a chart" section in the "Getting started" tutorial. Make sure you check it out.
Series
Adding
Like everywhere else, we use series' new() method to instantiate series, then push it into series list of the chart:
let series = chart.series.push(
  am5percent.FunnelSeries.new(root, {
    name: "Series",
    categoryField: "country",
    valueField: "sales",
    orientation: "vertical"
  })
);
var series = chart.series.push(
  am5percent.FunnelSeries.new(root, {
    name: "Series",
    categoryField: "country",
    valueField: "sales",
    orientation: "vertical"
  })
);
NOTE Series of a sliced chart require setting orientation so that chart knows how to orient the series.
The following series types are supported in a sliced chart:
These series types are available for percent charts:
| Class | Comment | |
|---|---|---|
FunnelSeries | A horizontal or vertical funnel. | More info |
PyramidSeries | A horizontal or vertical pyramid. | More info |
PictorialStackedSeries | A horizontal or vertical custom shape. | More info |
Data fields
Sliced chart series require two to dimensions of data: a string-based category and a numeric value.
Data fields basically mean which keys in data objects to look for specific value.
They can be set via series' settings categoryField and valueField.
Let's take sample data:
[{
  stage: "Stage #1",
  sales: 100000
}, {
  stage: "Stage #2",
  applicants: 70000
}, {
  stage: "Stage #3",
  applicants: 5500
}]
The following data fields would need to describe data fields like this:
let series = chart.series.push(
  am5xy.FunnelSeries.new(root, {
    name: "Series",
    categoryField: "stage",
    valueField: "applicants"
  })
);
var series = chart.series.push(
  am5xy.FunnelSeries.new(root, {
    name: "Series",
    categoryField: "stage",
    valueField: "applicants"
  })
);
Setting data
The data is set directly on series via its data property:
series.data.setAll([{
  stage: "Stage #1",
  applicants: 100000
}, {
  stage: "Stage #2",
  applicants: 70000
}, {
  stage: "Stage #3",
  applicants: 5500
}]);
series.data.setAll([{
  stage: "Stage #1",
  sales: 100000
}, {
  stage: "Stage #2",
  applicants: 70000
}, {
  stage: "Stage #3",
  applicants: 5500
}]);
For more information about setting data to series, refer to "Percent series: Setting data".
IMPORTANT It's a good practice to make sure that setting data happens as late into code as possible. Once you set data, all related objects are created, so any configuration settings applied afterwards might not carry over.
Slice colors
A series will automatically assign a different color to each of its slice.
The colors are defined in a theme used by the chart, and can be overridden in a number of ways.
For more information about it, refer to "Percent series: Slice colors".
Legend
To add a legend, we simply need to create an instance of a Legend class (which is a part of "core" package), push it to chart's children (or any other place we want it to be), as well as set its data (in case of percent chart, we will probably want to have each slice as a legend item).
let legend = chart.children.push(am5.Legend.new(root, {
  centerX: am5.percent(50),
  x: am5.percent(50),
  layout: root.horizontalLayout
}));

legend.data.setAll(series.dataItems);
var legend = chart.children.push(am5.Legend.new(root, {
  centerX: am5.percent(50),
  x: am5.percent(50),
  layout: root.horizontalLayout
}));

legend.data.setAll(series.dataItems);
MORE INFO For more information on how to configure the legend, set its contents, and other tricks, please visit our dedicated "Legend" tutorial.
Complete example
import * as am5 from "@amcharts/amcharts5";
import * as am5percent from "@amcharts/amcharts5/percent";

let chart = root.container.children.push(
  am5percent.SlicedChart.new(root, {
    layout: root.horizontalLayout
  })
);

// Define data
var data = [{
  country: "Stage #1",
  sales: 100000
}, {
  country: "Stage #2",
  sales: 70000
}, {
  country: "Stage #3",
  sales: 5500
}];

// Create series
let series = chart.series.push(
  am5percent.FunnelSeries.new(root, {
    name: "Series",
    valueField: "sales",
    categoryField: "country",
    orientation: "vertical",
    alignLabels: true
  })
);
series.data.setAll(data);

// Add legend
let legend = chart.children.push(am5.Legend.new(root, {
  centerX: am5.percent(50),
  y: am5.percent(50),
  layout: root.verticalLayout
}));

legend.data.setAll(series.dataItems);
<script src="https://cdn.amcharts.com/lib/5/index.js"></script>
<script src="https://cdn.amcharts.com/lib/5/percent.js"></script>

<div id="chartdiv"></div>

<script>
var chart = root.container.children.push(
  am5percent.SlicedChart.new(root, {
    layout: root.horizontalLayout
  })
);

// Define data
var data = [{
  country: "Stage #1",
  sales: 100000
}, {
  country: "Stage #2",
  sales: 70000
}, {
  country: "Stage #3",
  sales: 5500
}];

// Create series
var series = chart.series.push(
  am5percent.FunnelSeries.new(root, {
    name: "Series",
    valueField: "sales",
    categoryField: "country",
    orientation: "vertical",
    alignLabels: true
  })
);
series.data.setAll(data);

// Add legend
var legend = chart.children.push(am5.Legend.new(root, {
  centerX: am5.percent(50),
  y: am5.percent(50),
  layout: root.verticalLayout
}));

legend.data.setAll(series.dataItems);
</script>
See the Pen Funnel chart by amCharts team (@amcharts) on CodePen.
Multiple series
Sliced chart supports multiple series of any type: funnel, pyramid, or pictorial stacked.
We can also mix and match different types of series on a single chart.
All series we add, will be placed next to each other horizontally, divvying up the space in equal spaces.
See the Pen Funnel chart by amCharts team (@amcharts) on CodePen.
If we'd like to rather arrange series vertically, we will need to change layout for chart's seriesContainer:
chart.seriesContainer.set("layout", root.verticalLayout);
chart.seriesContainer.set("layout", root.verticalLayout);
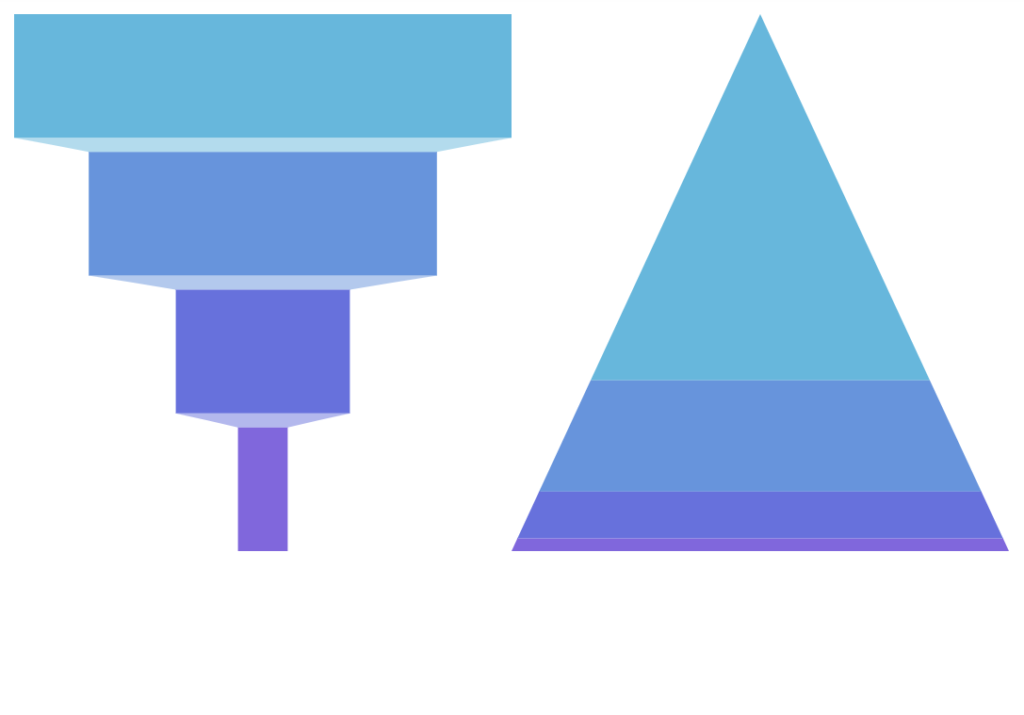
chart.seriesContainer.set("layout", root.verticalLayout)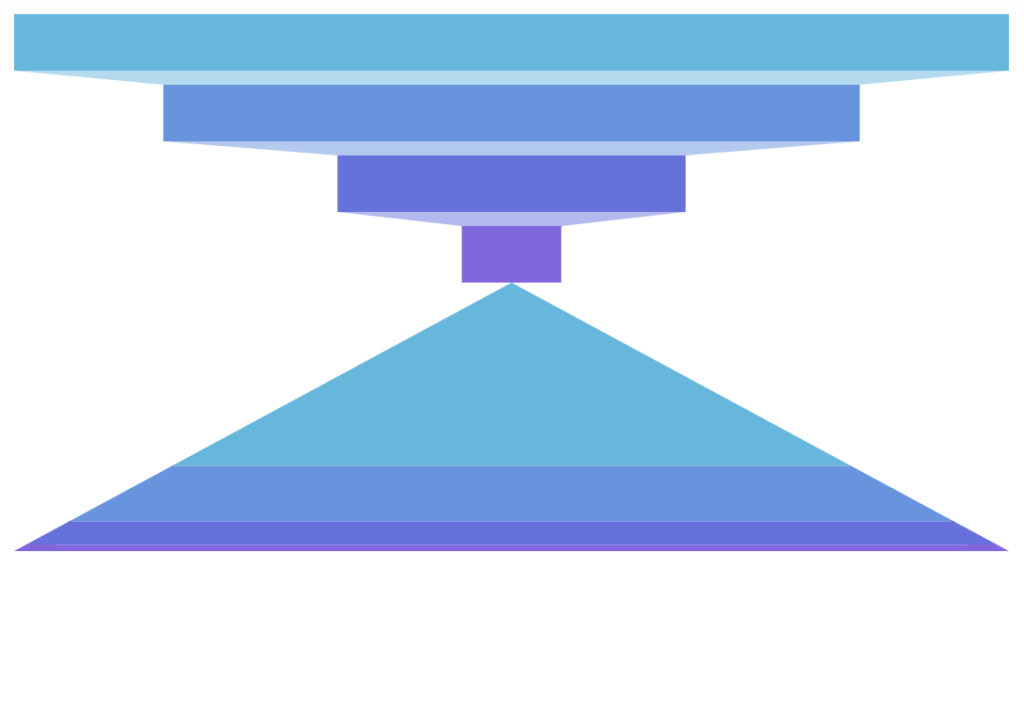
chart.seriesContainer.set("layout", root.verticalLayout)Animation
Normally, created series will appear on chart right away. Should we want to make it play out initial animation, we can call it's appear() method right after creating its object.
appear() method can also be called on the chart itself.
let series = chart.series.push(
  am5percent.FunnelSeries.new(root, {
    name: "Series",
    categoryField: "stage",
    valueField: "applicants"
  })
);
series.appear();
chart.appear();
var series = chart.series.push(
  am5percent.FunnelSeries.new(root, {
    name: "Series",
    categoryField: "stage",
    valueField: "applicants"
  })
);
series.appear();
chart.appear();
Bullets
Bullets can be added to a sliced series just like any other kind of series:
series.bullets.push(function(root) {
  return am5.Bullet.new(root, {
    sprite: am5.Label.new(root, {
      text: "{category2}",
      centerX: am5.p50,
      centerY: am5.p50,
      populateText: true
    })
  });
});
series.bullets.push(function(root) {
  return am5.Bullet.new(root, {
    sprite: am5.Label.new(root, {
      text: "{category2}",
      centerX: am5.p50,
      centerY: am5.p50,
      populateText: true
    })
  });
});
Here's an example:
See the Pen Funnel with bullets by amCharts team (@amcharts) on CodePen.