Line series is the most basic of all XY series. It is used to draw line and/or area plots.
Creating
Line series is created by instantiating LineSeries object using new() method, and pushing it into chart's series list:
let series = chart.series.push(
  am5xy.LineSeries.new(root, {
    name: "Series",
    xAxis: xAxis,
    yAxis: yAxis,
    valueYField: "value",
    valueXField: "date"
  })
);
var series = chart.series.push(
  am5xy.LineSeries.new(root, {
    name: "Series",
    xAxis: xAxis,
    yAxis: yAxis,
    valueYField: "value",
    valueXField: "date"
  })
);
Configuring appearance
Stroke and fill colors
Like with any series, it comes with stroke and fill color pre-set from the theme.
Should we want to override theme's color, we can set it's stroke and/or fill settings.
let series = chart.series.push(
  am5xy.LineSeries.new(root, {
    name: "Series",
    xAxis: xAxis,
    yAxis: yAxis,
    valueYField: "value",
    valueXField: "date",
    fill: am5.color(0x095256),
    stroke: am5.color(0x095256)
  })
);
var series = chart.series.push(
  am5xy.LineSeries.new(root, {
    name: "Series",
    xAxis: xAxis,
    yAxis: yAxis,
    valueYField: "value",
    valueXField: "date",
    fill: am5.color(0x095256),
    stroke: am5.color(0x095256)
  })
);
Line/fill settings
Stroke and fill colors are automatically used from series settings. All other options can be configured using series' element templates.
Line series has two of those: strokes.template (used to configure lines) and fills.template (used to configure fills).
The following code will set line width to 3 pixels and make it dashed, as well as make the line series into an area series, by setting fill opacity on fill template:
series.strokes.template.setAll({
  strokeWidth: 3,
  strokeDasharray: [10,5]
});
series.fills.template.setAll({
  fillOpacity: 0.5,
  visible: true
});
series.strokes.template.setAll({
  strokeWidth: 3,
  strokeDasharray: [10,5]
});
series.fills.template.setAll({
  fillOpacity: 0.5,
  visible: true
});
NOTE Note the visible: true in fills.template settings. It is needed because fills are disabled for line series by default.
See the Pen Stacked column chart 100% by amCharts team (@amcharts) on CodePen.
Simplifying the lines
If the line series has a lot of data points, they might get all crammed together, and make series look messy.
We can make line series skip some points that are closer than X pixels, by setting its minDistance setting:
let series = chart.series.push(
  am5xy.LineSeries.new(root, {
    name: "Series",
    xAxis: xAxis,
    yAxis: yAxis,
    valueYField: "value",
    valueXField: "date",
    minDistance: 10
  })
);
var series = chart.series.push(
  am5xy.LineSeries.new(root, {
    name: "Series",
    xAxis: xAxis,
    yAxis: yAxis,
    valueYField: "value",
    valueXField: "date",
    minDistance: 10
  })
);
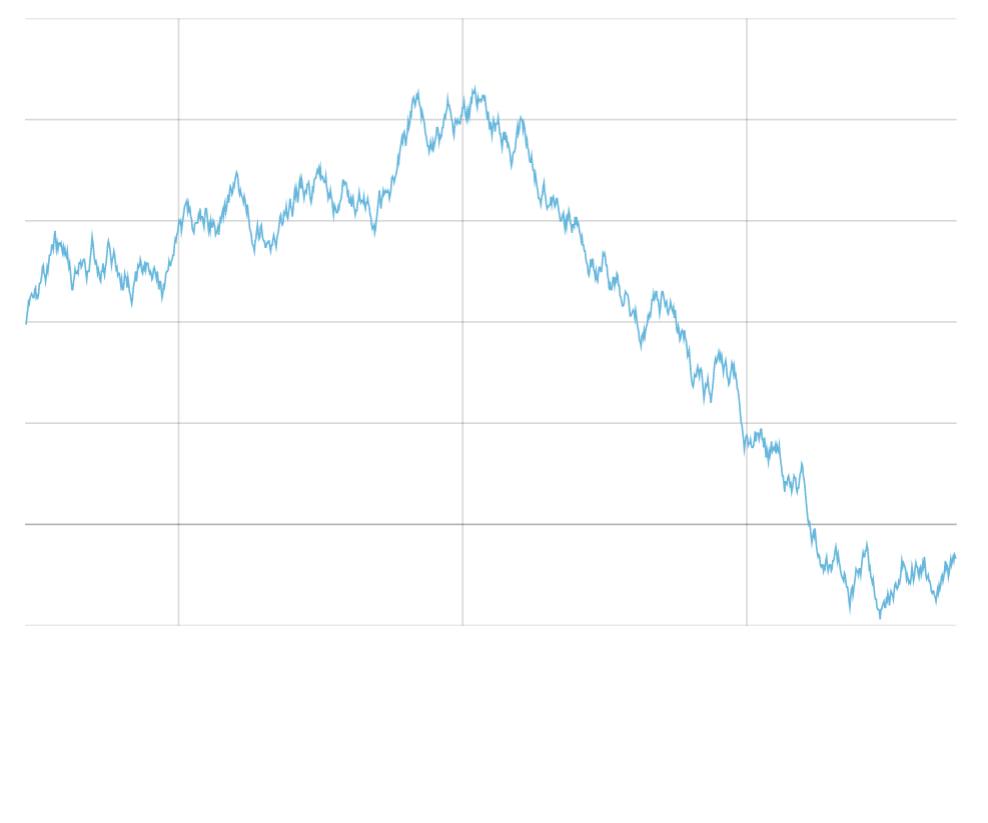
minDistance: 0 (default)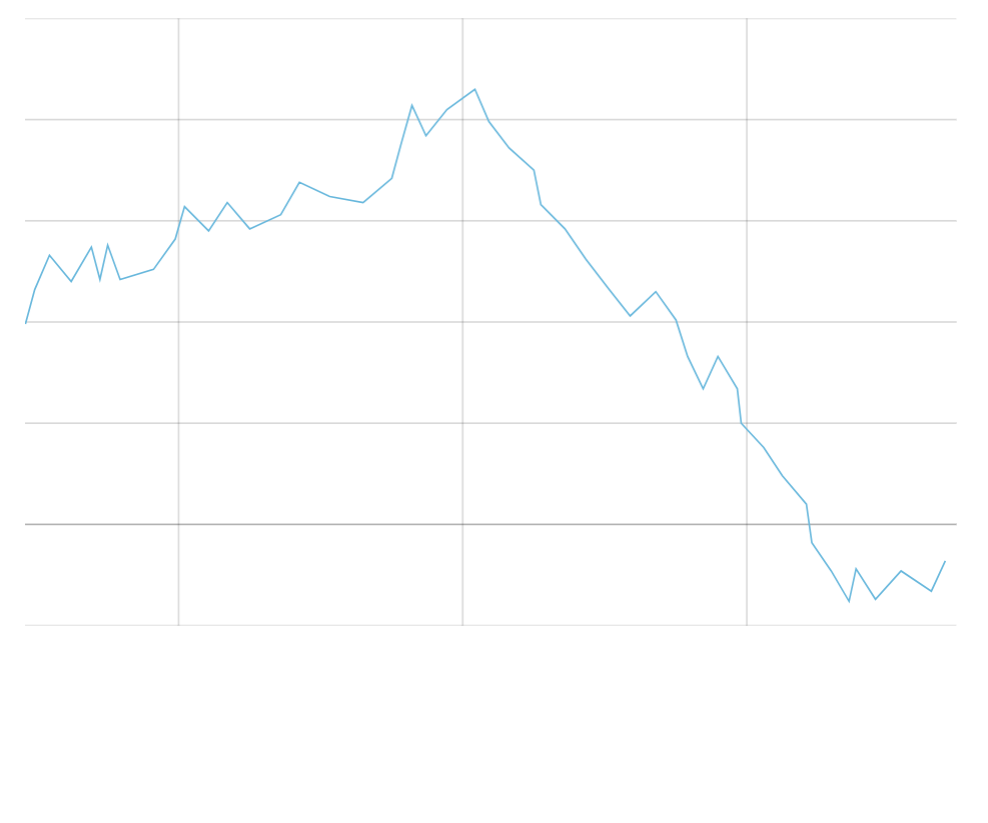
minDistance: 20Gaps
Enabling breaks
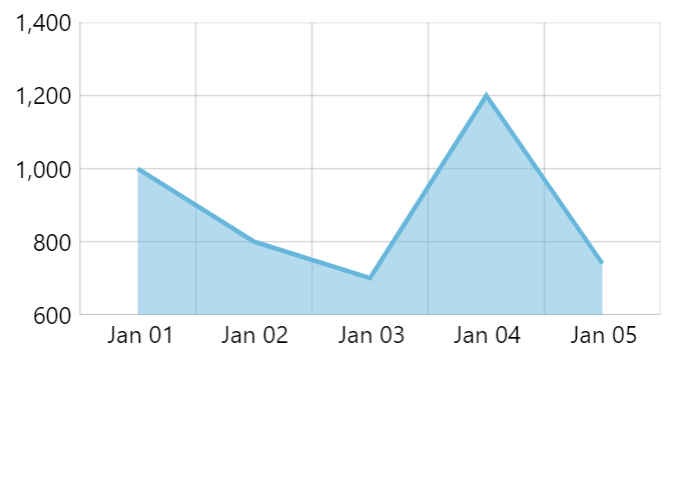
A line series is normally displayed as a continuous line, jumping over gaps in data by connecting two data items that do have data.
To make it break in cases where data is missing, we need to set series connect setting to false:
let series = chart.series.push(
  am5xy.LineSeries.new(root, {
    name: "Series",
    xAxis: xAxis,
    yAxis: yAxis,
    valueYField: "value",
    valueXField: "date",
    connect: false
  })
);
var series = chart.series.push(
  am5xy.LineSeries.new(root, {
    name: "Series",
    xAxis: xAxis,
    yAxis: yAxis,
    valueYField: "value",
    valueXField: "date",
    connect: false
  })
);
Now, the line will break in two cases:
- Empty data items (data is missing a key for data field or has
nullin it). - The two data items are further apart than set number of base intervals (only on charts where base axis is a date axis).
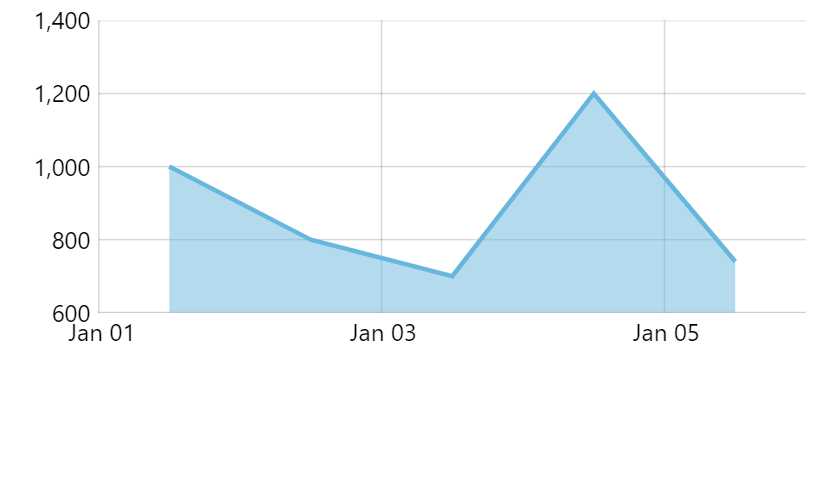
Empty data points
The data for chart can contain data items that do not have a value for the series as defined by its data fields:
[{
  date: new Date(2021, 0, 1).getTime(),
  value: 1000
}, {
  date: new Date(2021, 0, 2).getTime(),
  value: 800
}, {
  date: new Date(2021, 0, 3).getTime()
  // value is missing
}, {
  date: new Date(2021, 0, 4).getTime(),
  value: 800
}, {
  date: new Date(2021, 0, 5).getTime(),
  value: 800
}]
The value is missing for January 3rd, so the line will break over it displaying two separate segments: from Jan 1st to 2nd, and from 4th to 5th.
See the Pen Configuring LineSeries appearance by amCharts team (@amcharts) on CodePen.
Auto-gaps with dates
When using date axis as base axis for series, the line will also break if the distance between to data items is greater than granularity (as defined with baseInterval setting of the date axis) of the data, e.g. a day.
The above data example can be refactored to skip Jan 3rd altogether:
[{
  date: new Date(2021, 0, 1).getTime(),
  value: 1000
}, {
  date: new Date(2021, 0, 2).getTime(),
  value: 800
}, {
  date: new Date(2021, 0, 4).getTime(),
  value: 800
}, {
  date: new Date(2021, 0, 5).getTime(),
  value: 800
}]
The line will still break between Jan 2nd and 4th, because there's more than a day between them.
We can control the size of the gap that auto-break occurs on using series' autoGapCount setting.
For example, if we would want the line to break only when the data items are 3 days apart, we'd set it to something like 3.1.
let series = chart.series.push(
  am5xy.LineSeries.new(root, {
    name: "Series",
    xAxis: xAxis,
    yAxis: yAxis,
    valueYField: "value",
    valueXField: "date",
    connect: false,
    autoGapCount: 3.1
  })
);
var series = chart.series.push(
  am5xy.LineSeries.new(root, {
    name: "Series",
    xAxis: xAxis,
    yAxis: yAxis,
    valueYField: "value",
    valueXField: "date",
    connect: false,
    autoGapCount: 3.1
  })
);
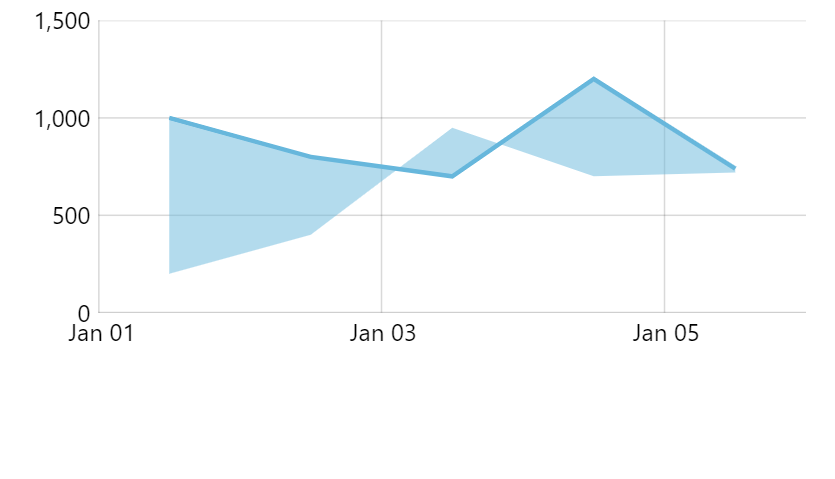
Open data fields
Line series is plotted on values we specify with input and display data fields. If we set up fills for the series, it will also fill the area all the way to the base axis.
If we'd like it to rather fill to some other values, we can use open data fields to point to values such fill should occur to.
let series = chart.series.push(
  am5xy.LineSeries.new(root, {
    name: "Series",
    xAxis: xAxis,
    yAxis: yAxis,
    valueYField: "value",
    valueXField: "date",
    openValueYField: "valueOpen"
  })
);
var series = chart.series.push(
  am5xy.LineSeries.new(root, {
    name: "Series",
    xAxis: xAxis,
    yAxis: yAxis,
    valueYField: "value",
    valueXField: "date",
    openValueYField: "valueOpen"
  })
);
openValueYField setSee the Pen LineSeries with breaks by amCharts team (@amcharts) on CodePen.
Data item location
Normally, line series places its data item (point) in the middle of axis cell.
We can modify that behavior using locationX and locationY settings.
Those are numeric values indicating relative position to the data item's axis cell: 0 - beginning, 0.5 - middle, 1 - end.
let series = chart.series.push(
  am5xy.LineSeries.new(root, {
    name: "Series",
    xAxis: xAxis,
    yAxis: yAxis,
    valueYField: "value",
    valueXField: "date",
    locationX: 0
  })
);
var series = chart.series.push(
  am5xy.LineSeries.new(root, {
    name: "Series",
    xAxis: xAxis,
    yAxis: yAxis,
    valueYField: "value",
    valueXField: "date",
    locationX: 0
  })
);
locationX: 0.5 (default)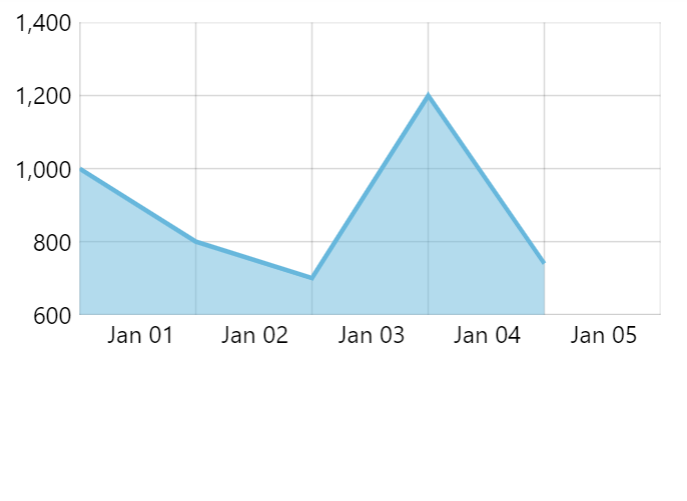
locationX: 0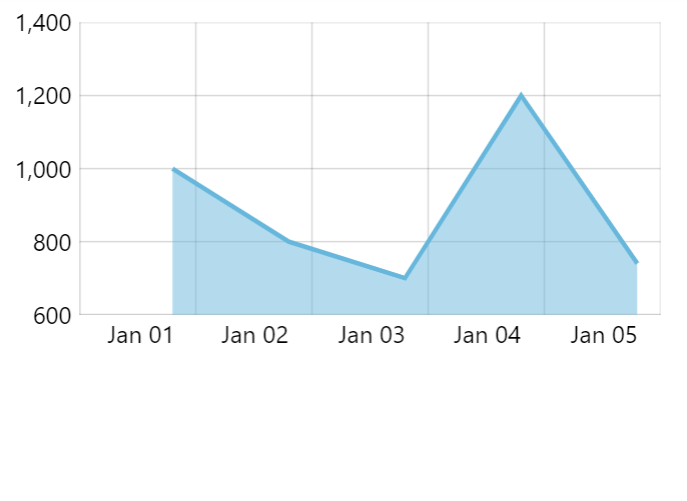
locationX: 0.8Using template fields
Template fields is a powerful concept allowing binding data values to settings of specific series elements.
We can use those to modify appearance of certain sections of line series.
Let's make our line series switch to dashed red line midway.
We will need to specify templateField for series' our strokes template: (we learned how strokes are set up using template earlier in this tutorial)
series.strokes.template.setAll({
  templateField: "strokeSettings"
});
series.strokes.template.setAll({
  templateField: "strokeSettings"
});
Then we add strokeSettings objects in our data at the data point we want the switch to occur:
[{
  date: new Date(2012, 1, 1).getTime(),
  value: 8
}, {
  date: new Date(2012, 1, 2).getTime(),
  value: 5
}, {
  date: new Date(2012, 1, 3).getTime(),
  value: 12,
  strokeSettings: {
    stroke: am5.color(0x990000),
    strokeDasharray: [3, 3]
  }
}, {
  date: new Date(2012, 1, 4).getTime(),
  value: 14
}, {
  date: new Date(2012, 1, 5).getTime(),
  value: 11
}]
Whenever template field value is encountered in data, the "current" style of line will become the one specified in the template field value, meaning all subsequent sections will be drawn using these additional settings.
See the Pen Using templateField on LineSeries troke by amCharts team (@amcharts) on CodePen.