Cursor is an optional functional component of an XY chart. It can be used to display crosshair over the hover/touch area, tooltips for some or all nearby series data items, as well as tooltips on axes.
Adding to chart
To add a cursor to an XY chart, we simply create an instance of an XYCursor using its new() method, then assign it to chart's cursor setting:
chart.set("cursor", am5xy.XYCursor.new(root, {}));
chart.set("cursor", am5xy.XYCursor.new(root, {}));
Behavior
Adding a cursor to charts adds a corsshair, shown when hovering the chart.
We can use cursor's behavior setting to specify what else it can do.
NOTE Enabling cursor behavior will disable chart's pan settings.
Zooming
To enabling zooming using cursor, we can set behavior to one of these values:
| Value | Comment |
|---|---|
zoomX | Enables horizontal selection-zooming. |
zoomY | Enables vertical selection-zooming. |
zoomXY | Enables bi-directional zooming. |
chart.set("cursor", am5xy.XYCursor.new(root, {
  behavior: "zoomX"
}));
chart.set("cursor", am5xy.XYCursor.new(root, {
  behavior: "zoomX"
}));
behavior: "zoomX"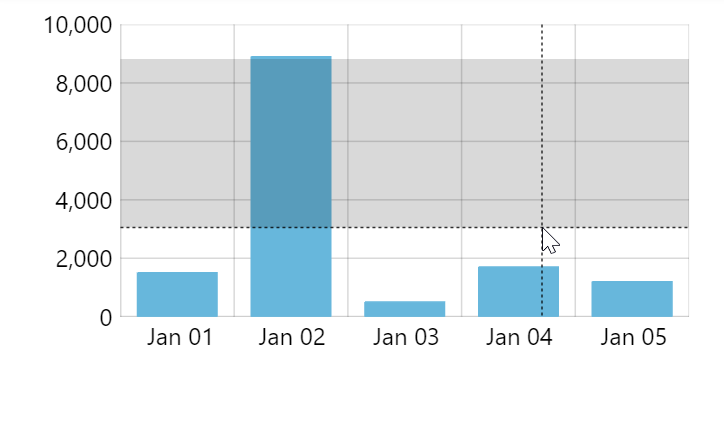
behavior: "zoomY"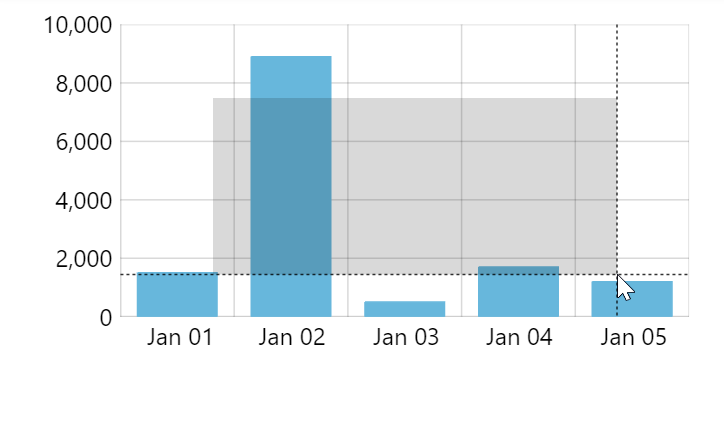
behavior: "zoomXY"Selection
We can also make cursor to just select the area of the chart, without actually zooming it using these behavior values:
| Value | Comment |
|---|---|
selectX | Enables horizontal selection. |
selectY | Enables vertical selection. |
selectXY | Enables bi-directional selection. |
It will work the same way as zooming, except the selection area will stay selected after user releases mouse/touch.
It can be useful in conjunction with selection-related event handlers.
Relation to series
Tooltips
Adding tooltip info to series
If series has tooltip property assigned to it, cursor will try to show multiple tooltips for all series in the currently hovered/touched category/interval.
For information on how to add tooltip to series, please refer to "XY chart series: Tooltips".
See the Pen Chart with cursor by amCharts team (@amcharts) on CodePen.
Limiting number of tooltips shown at a time
If our chart has many series with tooltips enabled, using cursor might result in quite a mess, that does not fit into the chart.
In such cases we can use XY chart's own maxTooltipDistance setting to make cursor show only closest tooltips.
It's a numeric value which means "show a tooltip to a closest data item as well as tooltips for data items that are visually no further from it by X pixels".
For example, setting it to 0 (zero) will make it show tooltip for the closest data item only.
let chart = root.container.children.push(
  am5xy.XYChart.new(root, {
    maxTooltipDistance: 0
  })
);
var chart = root.container.children.push(
  am5xy.XYChart.new(root, {
    maxTooltipDistance: 0
  })
);
maxTooltipDistance also has a special value: -1. Setting it will ensure that only one tooltip will be shown, no matter what. Even in case there are multiple data items in exact space spot.
maxTooltipDisatnce: 0The following demo shows how we can use maxTooltipDistance to show only single consolidated tooltip for multiple series.
See the Pen amCharts 5: Inversed value axis by amCharts team (@amcharts) on CodePen.
The distance used by maxTooltipDistance is measured by both X and Y coordinates by default.
If we'd like to measure only horizontal or vertical distance, we can use another setting: maxTooltipDistanceBy:
let chart = root.container.children.push(
  am5xy.XYChart.new(root, {
    maxTooltipDistance: 10,
    maxTooltipDistanceBy: "x"
  })
);
var chart = root.container.children.push(
  am5xy.XYChart.new(root, {
    maxTooltipDistance: 10,
    maxTooltipDistanceBy: "x"
  })
);
Auto-arranging tooltips
When cursor triggers multiple tooltips to be shown, they are automatically arranged to not overlap.
Should we want to disable this check, we can use chart's arrangeTooltips setting to false:
let chart = root.container.children.push(
  am5xy.XYChart.new(root, {
    arrangeTooltips: false
  })
);
var chart = root.container.children.push(
  am5xy.XYChart.new(root, {
    arrangeTooltips: false
  })
);
Snapping to series
A cursor can be made to snap to actual series data items.
To enable it we need to assign actual series objects we want cursor to snap to into cursor's snapToSeries setting.
chart.set("cursor", am5xy.XYCursor.new(root, {
  snapToSeries: [ series1, series2 ]
}));
chart.set("cursor", am5xy.XYCursor.new(root, {
  snapToSeries: [ series1, series2 ]
}));
By default, cursor will choose closest data item based on proximity by both X and Y coordinate. If we'd like it to rather snap horizontally or vertically we can set snapToSeriesBy to either "x" or "y", respectively.
chart.set("cursor", am5xy.XYCursor.new(root, {
  snapToSeries: [ series1, series2 ],
  snapToSeriesBy: "x"
}));
chart.set("cursor", am5xy.XYCursor.new(root, {
  snapToSeries: [ series1, series2 ],
  snapToSeriesBy: "x"
}));
snapToSeriesBy supports two additional values: "x!" and "y!".
They work similarly to "x" and "y" respectively, except they will only snap in intervals there are values in, reverting to free-move on intervals/categories there is no data for series that cursor is being snapped to.
IMPORTANTCursor relies on axis' tooltip for snapping position. This is why above settings won't function as expected if the related axis does not have tooltip enabled.
If we don't want the tooltip to be visible, we can hide it using forceHidden setting:
xAxis.set("tooltip", am5.Tooltip.new(root, {
  forceHidden: true
}));

yAxis.set("tooltip", am5.Tooltip.new(root, {
  forceHidden: true
}));
xAxis.set("tooltip", am5.Tooltip.new(root, {
  forceHidden: true
}));

yAxis.set("tooltip", am5.Tooltip.new(root, {
  forceHidden: true
}));
Irregularly spaced data
The cursor will snap to the closest data item from all the series it is supposed to snap to.
If series contain irregularly spaced data, e.g. series is missing a data item for the same timestamp that tooltip is currently snapped to based on a data item from another series, the tooltip for the former series will not be shown.
To force showing of a tooltip to the closest data item - even if its timestamp does not match currently snapped data item - set snapTooltip: true in series settings:
let series = chart.series.push(
  am5xy.LineSeries.new(root, {
    xAxis: xAxis,
    yAxis: yAxis,
    valueYField: "value",
    valueXField: "date",
    tooltip: am5.Tooltip.new(root, {
      labelText: "{valueX}: {valueY}",
    }),
    snapTooltip: true
  })
);
var series = chart.series.push(
  am5xy.LineSeries.new(root, {
    xAxis: xAxis,
    yAxis: yAxis,
    valueYField: "value",
    valueXField: "date",
    tooltip: am5.Tooltip.new(root, {
      labelText: "{valueX}: {valueY}",
    }),
    snapTooltip: true
  })
);
Relation to axes
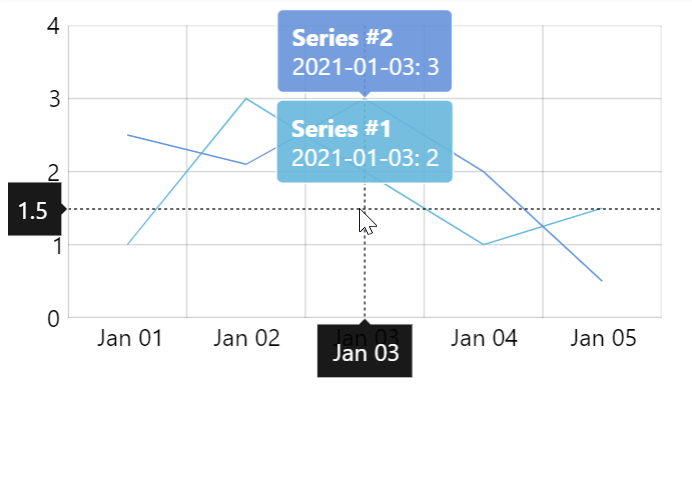
Axis tooltips
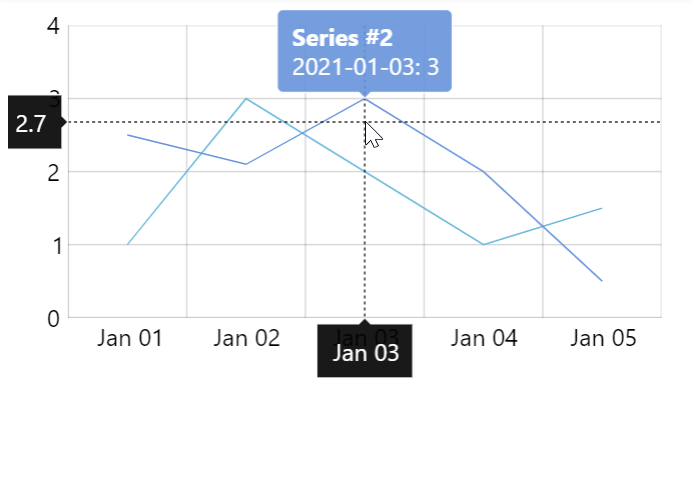
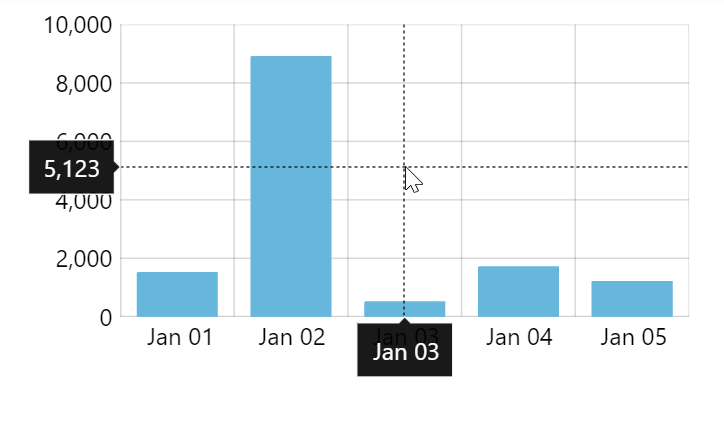
A cursor may display a tooltip with an exact value corresponding to the position of its vertical and horizontal crosshair lines.
To make that happen, we simply need to assign Tooltip instances to the tooltip setting of the axes we want to show tooltips on:
xAxis.set("tooltip", am5.Tooltip.new(root, {}));

yAxis.set("tooltip", am5.Tooltip.new(root, {}));
xAxis.set("tooltip", am5.Tooltip.new(root, {}));

yAxis.set("tooltip", am5.Tooltip.new(root, {}));
Snapping to axis cells
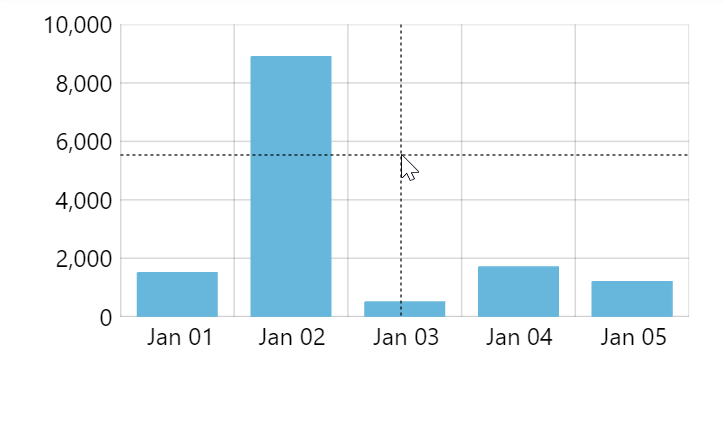
The crosshair lines will follow mouse/touch pointer by default.
We can make it rather snap to axis cell by setting cursor's xAxis or yAxis settings:
chart.set("cursor", am5xy.XYCursor.new(root, {
  xAxis: xAxis
}));
chart.set("cursor", am5xy.XYCursor.new(root, {
  xAxis: xAxis
}));
Appearance
Lines
An XY cursor has two properties: lineX and lineY that represent vertical and horizontal crosshair lines respectively.
Those are elements of type Grid that we can use to configure cursor's lines:
let cursor = chart.get("cursor");

cursor.lineX.setAll({
  stroke: am5.color(0x550000),
  strokeWidth: 2,
  strokeDasharray: []
});

cursor.lineY.setAll({
  visible: false
});
let cursor = chart.get("cursor");

cursor.lineX.setAll({
  stroke: am5.color(0x550000),
  strokeWidth: 2,
  strokeDasharray: []
});

cursor.lineY.setAll({
  visible: false
});
The above will apply color, remove dashing, and make vertical line thicker, while completely hide horizontal line.
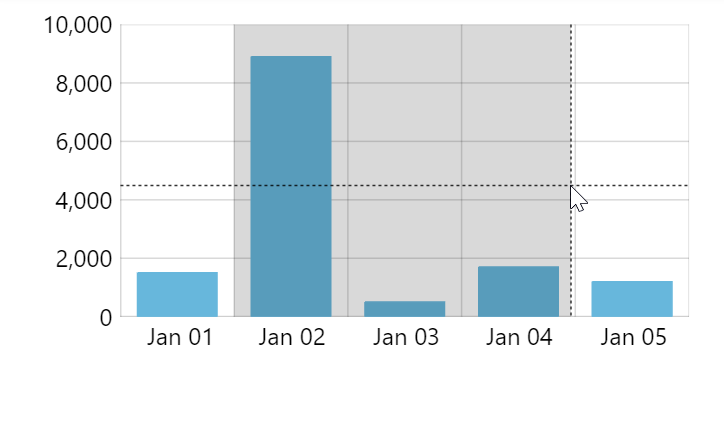
Selection
If cursor's behavior is set to zoom or select it will draw a shaded area to indicate selection when dragged on plot area.
That shading is done by displaying a custom element (Graphics) over plot area. It's accessible via selection property, and can be configured as needed:
let cursor = chart.get("cursor");

cursor.selection.setAll({
  fill: am5.color(0x000055),
  fillOpacity: 0.2
});
let cursor = chart.get("cursor");

cursor.selection.setAll({
  fill: am5.color(0x000055),
  fillOpacity: 0.2
});
Events
Cursor defines a few events that are dispatched when something happens.
For example, we can use its selectstarted and selectended events to track when selection using the cursor began and ended. There's also cursormoved event which we can use to track cursor movement.
For a complete list of events supported by XYCursor, check its class reference.
Tracking/setting position
Tracking cursor movement
We can use cursor's cursormoved event to invoke custom handler whenever cursor position on the plot area changes.
In event handler we can access its private properties positionX and positionY wich in turn can be converted to real position on axis using axis' methods:
cursor.events.on("cursormoved", function(ev) {
  let x = ev.target.getPrivate("positionX");
  let y = ev.target.getPrivate("positionY");

  let dateX = xAxis.positionToDate(x);
  let valueY = yAxis.positionToValue(y);
});
cursor.events.on("cursormoved", function(ev) {
  var x = ev.target.getPrivate("positionX");
  var y = ev.target.getPrivate("positionY");

  var dateX = xAxis.positionToDate(x);
  var valueY = yAxis.positionToValue(y);
});
Please note, that the above will work correctly only when axis is fully zoomed out. To be on the safe side, and account for zoomed-in sates, we should also use axis' toAxisPosition() method:
cursor.events.on("cursormoved", function(ev) {
  let x = ev.target.getPrivate("positionX");
  let y = ev.target.getPrivate("positionY");

  let dateX = xAxis.positionToDate(xAxis.toAxisPosition(x));
  let valueY = yAxis.positionToValue(xAxis.toAxisPosition(y));
});
cursor.events.on("cursormoved", function(ev) {
  var x = ev.target.getPrivate("positionX");
  var y = ev.target.getPrivate("positionY");

  var dateX = xAxis.positionToDate(xAxis.toAxisPosition(x));
  var valueY = yAxis.positionToValue(xAxis.toAxisPosition(y));
});
See the Pen Tracking XYCursor position by amCharts team (@amcharts) on CodePen.
Manually positioning cursor
We can manually position the cursor using its positionX and positionY settings.
We also want the cursor to display without hovering over plot area (which is default behavior), so we need to set alwaysShow to true as well.
Position is a numeric value relative to plot area, with 0 (zero) denoting beginning, and 1 (one) - the end.
So if we'd like to place the cursor in the exact middle of the chart, we'd use 0.5 for the setting value:
cursor.setAll({
  positionX: 0.5,
  positionY: 0.5,
  alwaysShow: true
});
cursor.setAll({
  positionX: 0.5,
  positionY: 0.5,
  alwaysShow: true
});
And, since we are using axes, we can use their methods to find out positions for specific values, e.g. on a date axis.
For that we need to use two functions:
- Axis'
dateToPosition()- converts aDateobject into a position. (similarly forCategoryAxisusecategoryToPosition(), and forValueAxis-valueToPosition()) - Axis renderer's
toGlobalPosition()- converts the position to a "global" position, which accounts for a possible axis zoom.
cursor.set("positionX", xAxis.get("renderer").toGlobalPosition(
  xAxis.dateToPosition(new Date(2021, 6, 12))
));
cursor.set("positionX", xAxis.get("renderer").toGlobalPosition(
  xAxis.dateToPosition(new Date(2021, 6, 12))
));
Setting cursor position requires respective axes to have a scale.
If we are setting cursor on chart load, we will need to use series datavalidated event:
series.events.on("datavalidated", function() {
  chart.get("cursor").setAll({
    positionX: 0.5,
    positionY: 0.5,
    alwaysShow: true
  });
});
series.events.on("datavalidated", function() {
  chart.get("cursor").setAll({
    positionX: 0.5,
    positionY: 0.5,
    alwaysShow: true
  });
});
See the Pen Setting xycursor position by amCharts team (@amcharts) on CodePen.
Syncing cursors
amCharts allows automatically syncing positions of cursors from several charts.
To enable this feature, all we need to do is to set cursor's syncWith setting with an array of cursor objects to sync it with:
let cursor1 = am5xy.XYCursor.new(root1, {});
let cursor2 = am5xy.XYCursor.new(root2, {});
let cursor3 = am5xy.XYCursor.new(root3, {});

cursor1.set("syncWith", [cursor2, cursor3]);
cursor2.set("syncWith", [cursor1, cursor3]);
cursor3.set("syncWith", [cursor1, cursor2]);

chart1.set("cursor", cursor1);
chart2.set("cursor", cursor2);
chart3.set("cursor", cursor3);
var cursor1 = am5xy.XYCursor.new(root1, {});
var cursor2 = am5xy.XYCursor.new(root2, {});
var cursor3 = am5xy.XYCursor.new(root3, {});

cursor1.set("syncWith", [cursor2, cursor3]);
cursor2.set("syncWith", [cursor1, cursor3]);
cursor3.set("syncWith", [cursor1, cursor2]);

chart1.set("cursor", cursor1);
chart2.set("cursor", cursor2);
chart3.set("cursor", cursor3);
IMPORTANTSyncing is performed using actual X/Y coordinates of the point of mouse cursor's position or touch. It means that they will not sync by axis positions, but rather by screen coordinates. For example vertical lines will not sync across horizontally laid out charts, and vice versa.
See the Pen amCharts 5: Syncing cursors across several charts by amCharts team (@amcharts) on CodePen.
MORE INFOFor syncing cursors across non-vertically arranged charts, refer to "Syncing cursors across multiple horizontally-arranged charts".
Keyboard control
Cursor can also be controlled using directional keys on a keyboard.
For more information, refer to "Accessibility: XY cursor" tutorial.