Radar chart reuses same axes types as XY chart. However it uses different axis renderers. While those are very similar to XY renderers in configuration, there some differences. This tutorial will address those.
Labels on a circular axis
Configuration of labels on an axis is done via axis renderer's labels.template property. For more information about it, please refer to "Axes: Labels" tutorial
Label type
Circular axis renderer positions its labels neatly curved along the axis line by default.
This can be configured via label template's textType setting.
Available options for use on a radar chart are: "circular" (default), "radial", and "adjusted".
xAxis.get("renderer").labels.template.setAll({
  fontSize: 12,
  textType: "radial"
});
xAxis.get("renderer").labels.template.setAll({
  fontSize: 12,
  textType: "radial"
});

textType: "circular" (default)
textType: "radial"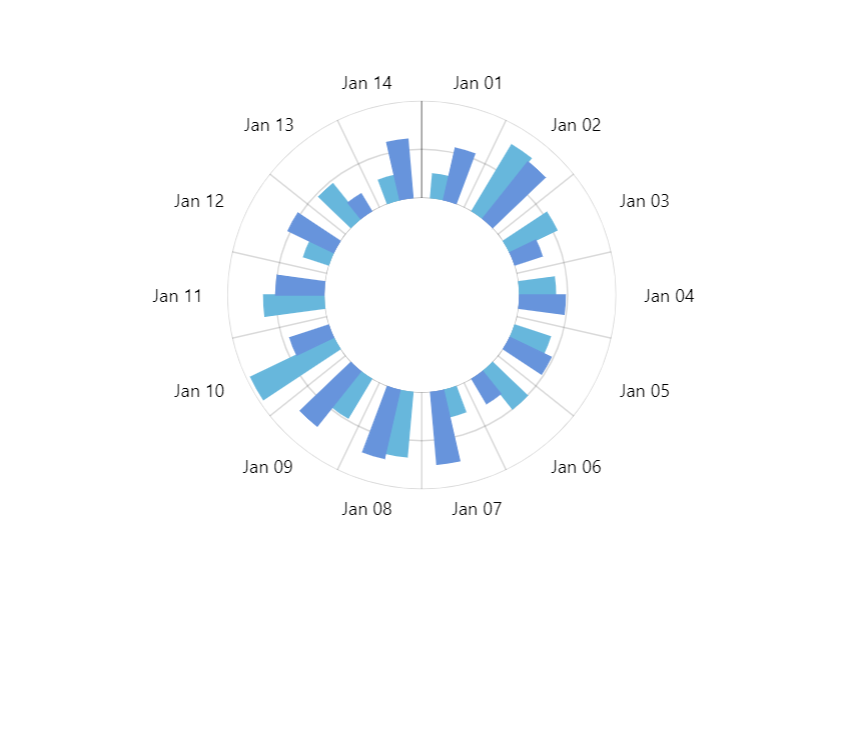
textType: "adjusted"See the Pen Radar chart with custom angles by amCharts team (@amcharts) on CodePen.
Label radius
Label setting radius that can be set via its template controls distance from the axis line.
It's a number in pixels. The higher the radius, the further from the slice edge the label will be:
xAxis.get("renderer").labels.template.setAll({
  fontSize: 12,
  textType: "radial",
  radius: 10
});
xAxis.get("renderer").labels.template.setAll({
  fontSize: 12,
  textType: "radial",
  radius: 10
});
Labels inside plot area
We can set inside setting to true on the label template, if we want the labels to appear inside charts plot area.
If we do so, the radius setting will revert: it will mean radius in pixels inwards, rather than outwards from the axis line.
xAxis.get("renderer").labels.template.setAll({
  fontSize: 12,
  textType: "radial",
  radius: 10,
  inside: true
});
xAxis.get("renderer").labels.template.setAll({
  fontSize: 12,
  textType: "radial",
  radius: 10,
  inside: true
});
Axis radii and angles
Just like radar chart itself can have radius, innerRadius, startAngle, and endAngle settings, so can circular axis renderer.
Percent value on radius and innerRadius work in relation to the radar chart itself, not chart container.
We can also use negative values in innerRadius. Those will mean pixel distance from the outer radius. This allows creating fixed-width axis.
startAngle and endAngle work just like for radar chart: we can specify where each axis starts and where it ends precisely, even if it is not the same values as the chart itself.
Here's an example of a radar chart using two circular axes with different angle settings:
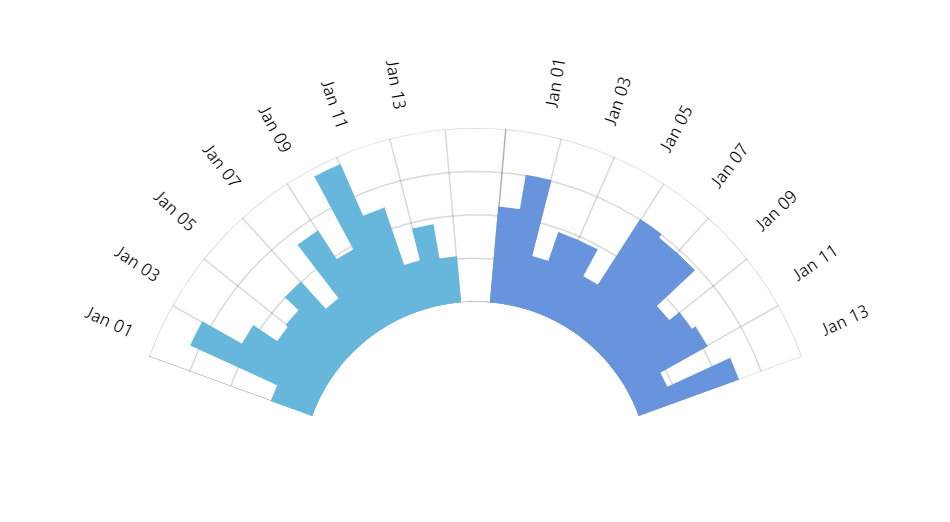
The above chart has following setup:
let chart = root.container.children.push(
  am5radar.RadarChart.new(root, {
    radius: am5.percent(70),
    innerRadius: am5.percent(50),
    startAngle: -160,
    endAngle: -20
  })
);

let xAxis1 = chart.xAxes.push(
  am5xy.DateAxis.new(root, {
    baseInterval: { timeUnit: "day", count: 1 },
    renderer: am5radar.AxisRendererCircular.new(root, {
      startAngle: -160,
      endAngle: -95
    })
  })
);

let xAxis2 = chart.xAxes.push(
  am5xy.DateAxis.new(root, {
    baseInterval: { timeUnit: "day", count: 1 },
    renderer: am5radar.AxisRendererCircular.new(root, {
      startAngle: -85,
      endAngle: -20
    })
  })
);
var chart = root.container.children.push(
  am5radar.RadarChart.new(root, {
    radius: am5.percent(70),
    innerRadius: am5.percent(50),
    startAngle: -160,
    endAngle: -20
  })
);

var xAxis1 = chart.xAxes.push(
  am5xy.DateAxis.new(root, {
    baseInterval: { timeUnit: "day", count: 1 },
    renderer: am5radar.AxisRendererCircular.new(root, {
      startAngle: -160,
      endAngle: -95
    })
  })
);

var xAxis2 = chart.xAxes.push(
  am5xy.DateAxis.new(root, {
    baseInterval: { timeUnit: "day", count: 1 },
    renderer: am5radar.AxisRendererCircular.new(root, {
      startAngle: -85,
      endAngle: -20
    })
  })
);
See the Pen Radar chart axis labels by amCharts team (@amcharts) on CodePen.