Flow charts depict natural progression of a value/item through nodes. The most notable flow chart types are Chord and Sankey diagrams, both supported by amCharts 5.
Loading required modules
Everything required to create flow charts are two amCharts 5 modules: "index" and "flow".
You can import those in your TypeScript / ES6 application as JavaScript modules:
import * as am5 from "@amcharts/amcharts5";
import * as am5flow from "@amcharts/amcharts5/flow";
For vanilla JavaScript applications and web pages, you can use "script" version:
<script src="https://cdn.amcharts.com/lib/5/index.js"></script>
<script src="https://cdn.amcharts.com/lib/5/flow.js"></script>
MORE INFO For more information on installing amCharts 5 as well as loading modules refer to our "Getting started" tutorial.
Series
Flow charts are chart-less. This means that rather than creating a chart element, we add series directly to the root container.
Adding
There are following types of series supported in flow charts:
| Class | Comment | |
|---|---|---|
Chord | A regular chord diagram. | More info |
ChordDirected | A chord diagramwith arrowed links/ribbons. | More info |
ChordNonRibbon | A chord diagram with narrow links lines. | More info |
Sankey | A Sankey diagram. | More info |
ArcDiagram | An Arc diagram. | More info |
Like everywhere else, we use its new() method to instantiate series, then push it into series list of the chart:
let series = root.container.children.push(
  am5flow.Sankey.new(root, {
    sourceIdField: "from",
    targetIdField: "to",
    valueField: "value"
  })
);
var series = root.container.children.push(
  am5flow.Sankey.new(root, {
    sourceIdField: "from",
    targetIdField: "to",
    valueField: "value"
  })
);
Data fields
Flow diagrams require three data fields:
- ID of the source node.
- ID of the target node.
- Value of the link between two nodes.
Data fields basically mean which keys in data objects to look for specific value.
They can be set via series' settings sourceIdField, targetIdField, and valueField.
Let's take sample data:
[{
  country: "France",
  sales: 100000
}, {
  country: "Spain",
  sales: 160000
}, {
  country: "United Kingdom",
  sales: 80000
}]
The following data fields would need to describe data fields like this:
let series = chart.series.push(
  am5xy.PieSeries.new(root, {
    name: "Series",
    categoryField: "country",
    valueField: "sales"
  })
);
var series = chart.series.push(
  am5xy.PieSeries.new(root, {
    name: "Series",
    categoryField: "country",
    valueField: "sales"
  })
);
Setting data
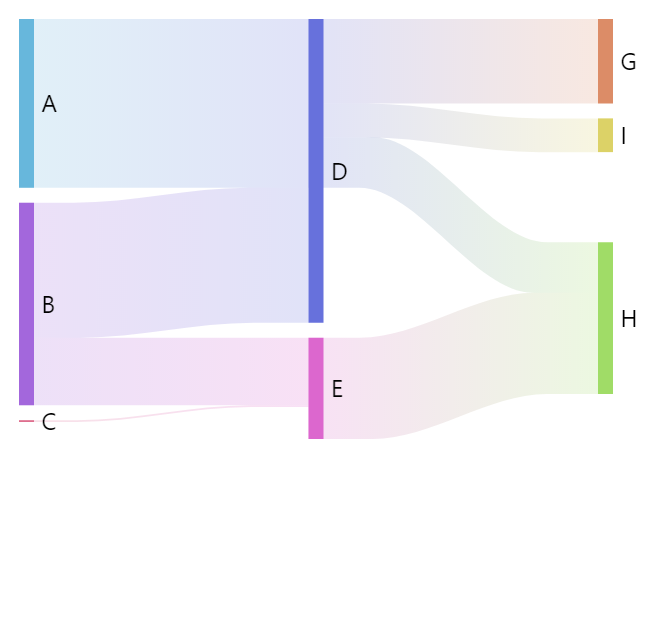
In flow charts, each entry in data represents a link. It identifies source and target nodes, as well as numeric value of the link.
The links can be multi-level, meaning that nodes that don't have any other nodes linking to them will form the first level, then the nodes they link to, and so on.
The data is set directly on series via its data property:
series.data.setAll([
  { from: "A", to: "B", value: 10 },
  { from: "B", to: "C", value: 8 },
  { from: "C", to: "D", value: 4 },
  { from: "C", to: "E", value: 3 },
  { from: "D", to: "G", value: 5 },
  { from: "D", to: "I", value: 2 },
  { from: "D", to: "H", value: 3 },
  { from: "E", to: "H", value: 6 },
  { from: "G", to: "J", value: 5 },
  { from: "I", to: "J", value: 1 },
  { from: "H", to: "J", value: 9 }
]);
IMPORTANT It's a good practice to make sure that setting data happens as late into code as possible. Once you set data, all related objects are created, so any configuration settings applied afterwards might not carry over.
MORE INFO There are more ways to set, update, add, or load data. For more information please refer to our dedicated "Data" tutorial.
Minimum node size
Nodes/links in flow diagrams are sized by their value relatively to the sum of all values.
In some cases, this may result in very small nodes.
To ensure that that does not happen, there is a setting: minSize.
If set to a number it will override value for small nodes with a bigger value calculated from a sum of all the nodes.
For example, if we set minSize: 0.01 the minimum value a node would be sized again would be 1% of the sum of values of all of the nodes in series.
let series = root.container.children.push(am5flow.Sankey.new(root, {
  sourceIdField: "from",
  targetIdField: "to",
  valueField: "value",
  minSize: 0.03
}));
var series = root.container.children.push(am5flow.Sankey.new(root, {
  sourceIdField: "from",
  targetIdField: "to",
  valueField: "value",
  minSize: 0.03
}));

minSize: 0.05Node toggling
Nodes in all Flow series (Sankey, Chord, and Arc) are togglable by default.
Disabling toggling
To disable toggling, use toggleKey and cursorOverStyle settings of the node template:
series.nodes.nodes.template.setAll({
  toggleKey:"none",
  cursorOverStyle:"default"
});
series.nodes.nodes.template.setAll({
  toggleKey:"none",
  cursorOverStyle:"default"
});
Configuring toggled off nodes
By default, a toggled off node will shrink down and fade out, it's links will be hidden completely.
The relative size of the shrunken node can be controlled with the series' hiddenSize (default: 0.05), and minHiddenValue (default: 0) settings.
Similarly to minSize (explained above), it means a relative fraction of the sum of all node values. E.g. if all nodes sum up to 100, a hiddenSize: 0.05 will mean that hidden node will be sized like it would have a value of 5.
minHiddenValue (default: 0) can be used to not allow the relative value - used for sizing the hidden node - to go below certain threshold. E.g. if it is set to 1, and it's hidden value gets down to 0.5, it will still be sized like it would have a value of 1.
let series = root.container.children.push(am5flow.Sankey.new(root, {
  sourceIdField: "from",
  targetIdField: "to",
  valueField: "value",
  hiddenSize: 0.03,
  minHiddenValue: 1
}));
var series = root.container.children.push(am5flow.Sankey.new(root, {
  sourceIdField: "from",
  targetIdField: "to",
  valueField: "value",
  hiddenSize: 0.03,
  minHiddenValue: 1
}));
Pre-hidden nodes
It's also possible to pre-hide nodes using node series setting disabledField and separate node data, e.g.:
series.nodes.setAll({
  disabledField: "disabled",
});

series.nodes.data.setAll([
  { id: "A", name: "A", disabled: true },
  { id: "H", name: "H", disabled: true }
]);
series.nodes.setAll({
  disabledField: "disabled",
});

series.nodes.data.setAll([
  { id: "A", name: "A", disabled: true },
  { id: "H", name: "H", disabled: true }
]);
See the Pen Pre-hidden nodes in Sankey by amCharts team (@amcharts) on CodePen.
Series appearance
For more information about configuring appearance of the flow series, refer to respective tutorials:
Complete example
import * as am5 from "@amcharts/amcharts5";
import * as am5flow from "@amcharts/amcharts5/flow";

// Create root and chart
let root = am5.Root.new("chartdiv");

// Set themes
root.setThemes([
  am5themes_Animated.new(root)
]);

// Create series
let series = root.container.children.push(
  am5flow.Sankey.new(root, {
    sourceIdField: "from",
    targetIdField: "to",
    valueField: "value",
    paddingRight: 50
  })
);

series.nodes.get("colors").set("step", 2);

// Set data
series.data.setAll([
  { from: "A", to: "B", value: 10 },
  { from: "B", to: "C", value: 8 },
  { from: "C", to: "D", value: 4 },
  { from: "C", to: "E", value: 3 },
  { from: "D", to: "G", value: 5 },
  { from: "D", to: "I", value: 2 },
  { from: "D", to: "H", value: 3 },
  { from: "E", to: "H", value: 6 },
  { from: "G", to: "J", value: 5 },
  { from: "I", to: "J", value: 1 },
  { from: "H", to: "J", value: 9 }
]);
<script src="https://cdn.amcharts.com/lib/5/index.js"></script>
<script src="https://cdn.amcharts.com/lib/5/flow.js"></script>

<div id="chartdiv"></div>

<script>
// Create root and chart
var root = am5.Root.new("chartdiv");

// Set themes
root.setThemes([
  am5themes_Animated.new(root)
]);

// Create series
const series = root.container.children.push(
  am5flow.Sankey.new(root, {
    sourceIdField: "from",
    targetIdField: "to",
    valueField: "value",
    paddingRight: 50
  })
);

series.nodes.get("colors").set("step", 2);

// Set data
series.data.setAll([
  { from: "A", to: "B", value: 10 },
  { from: "B", to: "C", value: 8 },
  { from: "C", to: "D", value: 4 },
  { from: "C", to: "E", value: 3 },
  { from: "D", to: "G", value: 5 },
  { from: "D", to: "I", value: 2 },
  { from: "D", to: "H", value: 3 },
  { from: "E", to: "H", value: 6 },
  { from: "G", to: "J", value: 5 },
  { from: "I", to: "J", value: 1 },
  { from: "H", to: "J", value: 9 }
]);
</script>
See the Pen Radar chart axis labels by amCharts team (@amcharts) on CodePen.
Additional controls
Flow is a "container-less" chart. This means that there's no wrapper "chart" element, that can be used to add series and external controls to.
If we don't need anything else besides series, we can add it directly to the container of the root element.
However, if we need to add other elements, we'll need to first create a "wrapper (or main) container", we'll be using add all the stuff to:
let container = root.container.children.push(am5.Container.new(root, {
  width: am5.percent(100),
  height: am5.percent(100),
  layout: root.verticalLayout
}));
var container = root.container.children.push(am5.Container.new(root, {
  width: am5.percent(100),
  height: am5.percent(100),
  layout: root.verticalLayout
}));
NOTEThe layout setting of the wrapper container will determine how chart elements are laid out. For more information, refer to "Containers: Layout".
Chart title
Chart title can be added as a Label element child to the wrapper container:
let title = container.children.push(am5.Label.new(root, {
  text: "User flow",
  fontSize: 20,
  x: am5.percent(50),
  centerX: am5.percent(50)
}));
var title = container.children.push(am5.Label.new(root, {
  text: "User flow",
  fontSize: 20,
  x: am5.percent(50),
  centerX: am5.percent(50)
}));
Further reading
For more information about configuring each type of series visit these tutorials: