Drawing control allows using a number of tools to dynamically add annotations to the chart. They can be as simple as a rectangle or a free-draw doodle, or as complex as a Fibonacci indicator.
Prerequisites
Some of the drawing tools can be used on any chart.
Some will require main series to be set on the chart, while other will require main volume series, too.
Adding
Like any other control, it should be instantiated using new() syntax, and pushed into toolbar's controls list:
let toolbar = am5stock.StockToolbar.new(root, {
  container: document.getElementById("chartcontrols"),
  stockChart: stockChart,
  controls: [
    am5stock.DrawingControl.new(root, {
      stockChart: stockChart
    })
  ]
});
var toolbar = am5stock.StockToolbar.new(root, {
  container: document.getElementById("chartcontrols"),
  stockChart: stockChart,
  controls: [
    am5stock.DrawingControl.new(root, {
      stockChart: stockChart
    })
  ]
});
See the Pen Stock chart controls by amCharts team (@amcharts) on CodePen.
Configuring
Tool list
By default, the tool selector in drawing mode will show all available drawing tools.
We can change that using drawing control's setting tools.
It accepts an array of tool names, with default being this:
[
  "Arrows & Icons",
  "Average",
  "Callout",
  "Doodle",
  "Ellipse",
  "Fibonacci",
  "Fibonacci Timezone",
  "Horizontal Line",
  "Horizontal Ray",
  "Label",
  "Line",
  "Measure",
  "Parallel Channel",
  "Polyline",
  "Quadrant Line",
  "Rectangle",
  "Regression",
  "Trend Line",
  "Vertical Line"
]
The following will limit drawing tools to "Doodle", "Line", and "Rectangle":
let toolbar = am5stock.StockToolbar.new(root, {
  container: document.getElementById("chartcontrols"),
  stockChart: stockChart,
  controls: [
    am5stock.DrawingControl.new(root, {
      stockChart: stockChart,
      tools: ["Doodle", "Line", "Rectangle"]
    })
  ]
});
var toolbar = am5stock.StockToolbar.new(root, {
  container: document.getElementById("chartcontrols"),
  stockChart: stockChart,
  controls: [
    am5stock.DrawingControl.new(root, {
      stockChart: stockChart,
      tools: ["Doodle", "Line", "Rectangle"]
    })
  ]
});
Tool settings
We can also specify custom settings for each drawing tool using control's toolSettings setting, which accepts an object where key is a name of the tool, and value is an object of settings.
let toolbar = am5stock.StockToolbar.new(root, {
  container: document.getElementById("chartcontrols"),
  stockChart: stockChart,
  controls: [
    am5stock.DrawingControl.new(root, {
      stockChart: stockChart,
      toolSettings: {
        "Fibonacci": {
          sequence: [0, 3.618, 4.236],
          colors: [
            am5.color(0xff0000),
            am5.color(0x00ff00),
            am5.color(0x0000ff)
          ]
        }
      }
    })
  ]
});
var toolbar = am5stock.StockToolbar.new(root, {
  container: document.getElementById("chartcontrols"),
  stockChart: stockChart,
  controls: [
    am5stock.DrawingControl.new(root, {
      stockChart: stockChart,
      toolSettings: {
        "Fibonacci": {
          sequence: [0, 3.618, 4.236],
          colors: [
            am5.color(0xff0000),
            am5.color(0x00ff00),
            am5.color(0x0000ff)
          ]
        }
      }
    })
  ]
});
Colors
Color pickers used by drawing control use a pre-defined default list of colors:
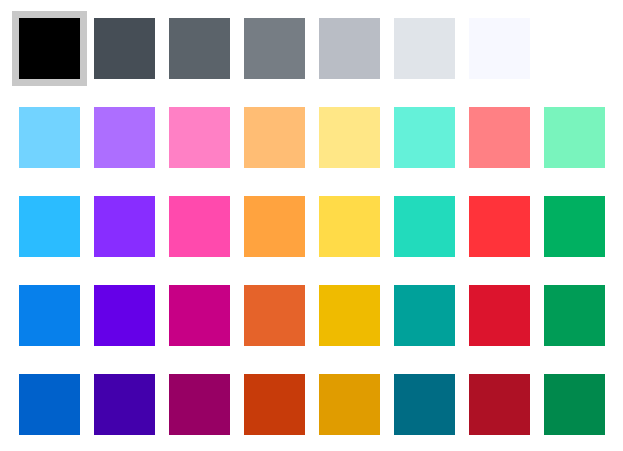
We can override the list using drawing control's colors setting, which accepts an ColorSet object.
let toolbar = am5stock.StockToolbar.new(root, {
  container: document.getElementById("chartcontrols"),
  stockChart: stockChart,
  controls: [
    am5stock.DrawingControl.new(root, {
      stockChart: stockChart,
      colors: ColorSet.new(this._root, {
        colors: [
          color(0x000000),
          color(0x464e56),
          color(0x5b636a),
          color(0x767d84),
          color(0xb9bdc5),
          color(0xe0e4e9),
          color(0xf7f8ff),
          color(0xffffff),
        ]
      })
    })
  ]
});
var toolbar = am5stock.StockToolbar.new(root, {
  container: document.getElementById("chartcontrols"),
  stockChart: stockChart,
  controls: [
    am5stock.DrawingControl.new(root, {
      stockChart: stockChart,
      colors: ColorSet.new(this._root, {
        colors: [
          color(0x000000),
          color(0x464e56),
          color(0x5b636a),
          color(0x767d84),
          color(0xb9bdc5),
          color(0xe0e4e9),
          color(0xf7f8ff),
          color(0xffffff),
        ]
      })
    })
  ]
});
Custom icons
We can manipulate the list of icons offered by the "Arrows & Icons" drawing tool using drawing control's drawingIcons setting.
It's an array of object defining available icons.
Here's a typical structure of an icon definition:
{
  svgPath: "M 5 35 L 5 15 L 26 15 L 26 5 L 45 25 L 26 45 L 26 35 L 5 35 Z",
  scale: 1,
  centerX: am5.percent(100),
  centerY: am5.percent(50)
}
The four items in it are as follows:
svgPath- an path defining shape of the icon (more details).scale- a relative scale of the icon. The SVG path has its own internal size. If it's too big or too small to be used in the chart, we may apply the scale here.centerX- horizontal center of the icon.centerY- vertical center of the icon.
The center settings are important for placement of the icon. The center of the icon will be placed exactly on the coordinate where user clicks in the chart.
To add additional icons, we can simply push icon objects into rawingIcons array:
let drawingControl = am5stock.DrawingControl.new(root, {
  stockChart: stockChart
});

drawingControl.get("drawingIcons").push({
  svgPath: "M 3 3 L 47 3 L 47 39 L 31 39 L 25 45 L 19 39 L 3 39 L 3 3 M 11 12 L 39 12 M 11 20 L 39 20 M 11 28 L 39 28",
  scale: 1,
  centerX: am5.p50,
  centerY: am5.p100
}, {
  svgPath: "M 5 11 A 1 1 90 0 0 36 27 A 1 1 90 0 0 5 11 M 34 30 L 49 45 L 47 47 L 32 32",
  scale: 1,
  centerX: am5.p50,
  centerY: am5.p50
});
var drawingControl = am5stock.DrawingControl.new(root, {
  stockChart: stockChart
});

drawingControl.get("drawingIcons").push({
  svgPath: "M 3 3 L 47 3 L 47 39 L 31 39 L 25 45 L 19 39 L 3 39 L 3 3 M 11 12 L 39 12 M 11 20 L 39 20 M 11 28 L 39 28",
  scale: 1,
  centerX: am5.p50,
  centerY: am5.p100
}, {
  svgPath: "M 5 11 A 1 1 90 0 0 36 27 A 1 1 90 0 0 5 11 M 34 30 L 49 45 L 47 47 L 32 32",
  scale: 1,
  centerX: am5.p50,
  centerY: am5.p50
});
Or we can replace the list altogether with our own icons:
let drawingControl = am5stock.DrawingControl.new(root, {
  stockChart: stockChart,
  drawingIcons: [
    // ...
  ]
});
var drawingControl = am5stock.DrawingControl.new(root, {
  stockChart: stockChart,
  drawingIcons: [
    // ...
  ]
});
Example:
See the Pen Stock Chart by amCharts team (@amcharts) on CodePen.
Other settings
Please refer to drawing control's setting reference for a complete list of its configuration options.
Standalone usage / API
Instantiating object
We can use drawing control's drawing functionality without adding it to a stock toolbar or even without toolbar at all.
We'll just need to instantiate a standalone object of the DrawingControl class.
let drawingControl = am5stock.DrawingControl.new(root, {
  stockChart: stockChart
});
var drawingControl = am5stock.DrawingControl.new(root, {
  stockChart: stockChart
});
Enabling draw mode
To turn on the drawing mode we need to:
- Set
activesetting totrue. - Set
toolsetting to whatever tool we want it to use. - Optionally, set any additional settings like
strokeColor, etc.
The following code will turn drawing mode on, and will select a "Doodle" tool with red color:
drawingControl.setAll({
  active: true,
  tool: "Doodle",
  strokeColor: am5.color(0xff0000)
});
drawingControl.setAll({
  active: true,
  tool: "Doodle",
  strokeColor: am5.color(0xff0000)
});
Available tools
"Average""Callout""Doodle""Ellipse""Fibonacci""Fibonacci Timezone""Horizontal Line""Horizontal Ray""Arrows & Icons""Label""Line""Measure""Parallel Channel""Polyline""Quadrant Line""Rectangle""Regression""Trend Line""Vertical Line"
Available settings
Please refer to the class reference of the DrawingControl for a complete list of available settings.
Exiting draw mode
To exit the draw mode, simply set active: false on your drawing control object:
drawingControl.set("active", false);
drawingControl.set("active", false);
Clearing drawings
Use use clearDrawings() to clear all drawings.
drawingControl.clearDrawings();
drawingControl.clearDrawings();
Toggling eraser
To toggle eraser on and off use setEraser(true | false).
drawingControl.setEraser(true);
drawingControl.setEraser(true);
Example
See the Pen Stock Chart by amCharts team (@amcharts) on CodePen.
Adding line drawings
Drawing control has a method addLine() which can be used to dynamically add line-type drawings (supported tools are: Horizontal Line, Vertical Line, and Ray) via API.
drawingControl.addLine("Horizontal Line", mainPanel, {
  x: 100,
  y: 100
});
drawingControl.addLine("Horizontal Line", mainPanel, {
  x: 100,
  y: 100
});
It accepts 3 parameters:
- Tool name (
"Horizontal Line","Horizontal Ray","Vertical Line"). - Panel reference to add the drawing to.
- Local points to add it to.
See the Pen Adding horizontal line drawing dynamically on a Stock Chart by amCharts team (@amcharts) on CodePen.