A container is an element that can have child elements as well as a background. Most of the elements on a chart are containers. The chart itself is also a container.
Root container
When we create a root element it comes with a container of itself.
Any top-level element - e.g. chart - will need to go into that root container as a child.
Root container is accessible by root.container.
Children
Adding
To add a child to a container, all we need to do is push() it into children list.
Here's how we'd add a footnote label to a chart:
let footnote = chart.children.push(am5.Label.new(root, {
  text: "Copyright 2021 amCharts"
});
var footnote = chart.children.push(am5.Label.new(root, {
  text: "Copyright 2021 amCharts"
});
Ordering
Using push() method will add a child at the end of the child list. If container has a layout set it will be drawn last.
To put it in the first position, we can use unshift() instead.
Or, if we want to be super precise, we can use insertIndex() which accepts first parameter an index.
Using insertIndex(0, ...) is equovalent to unshift(...).
Layout
Setting layout
Container's layout setting affects how child elements in it are arranged.
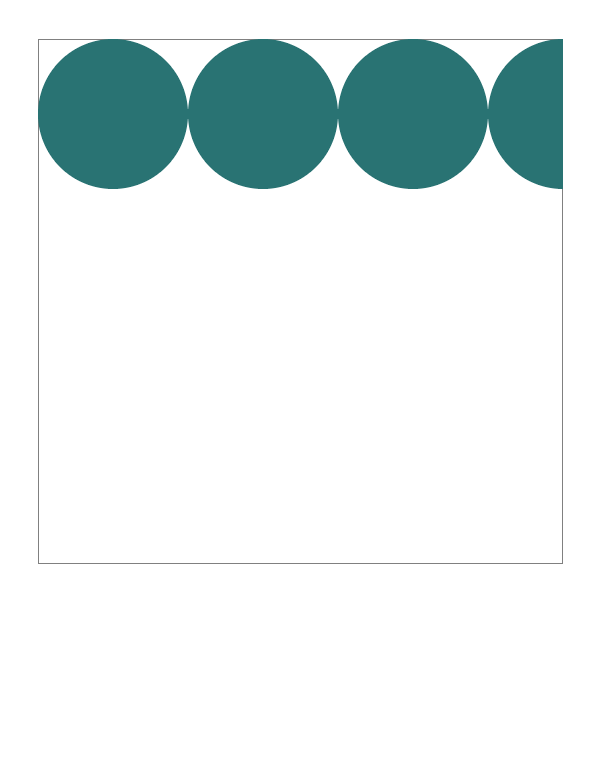
It can be either vertical, horizontal, grid, or none.
A layout is represented by an object, accessible visa root properties.
| Layout instance | Comment |
|---|---|
root.horizontalLayout | Child elements are displayed in a row. |
root.verticalLayout | Child elements are displayed stacked vertically. |
root.gridLayout | Child elements are displayed in a grid of columns, and can form multiple rows. |
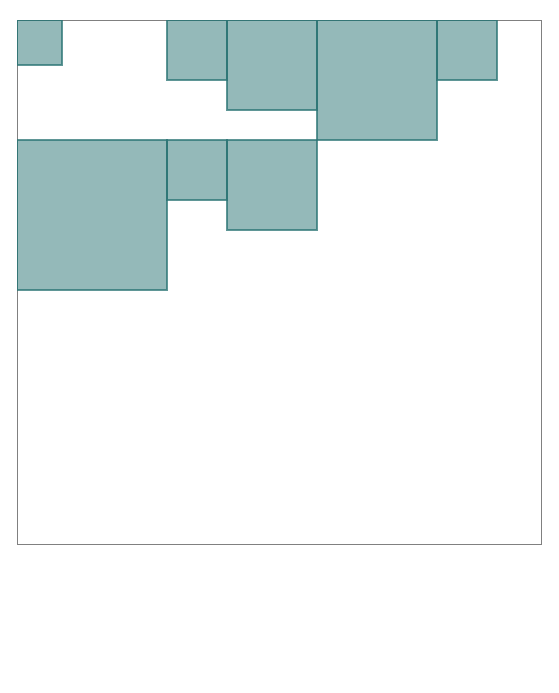
| Not set | Child elements are placed at whatever x and/or y setting are set for them, or at upper-left corner if not set. |
Setting layout might affect the look of the chart setup, such as where chart's legend is placed.
let chart = root.container.children.push(
  am5percent.PieChart.new(root, {
    layout: root.verticalLayout
  })
);
var chart = root.container.children.push(
  am5percent.PieChart.new(root, {
    layout: root.verticalLayout
  })
);
layout: root.horizontalLayout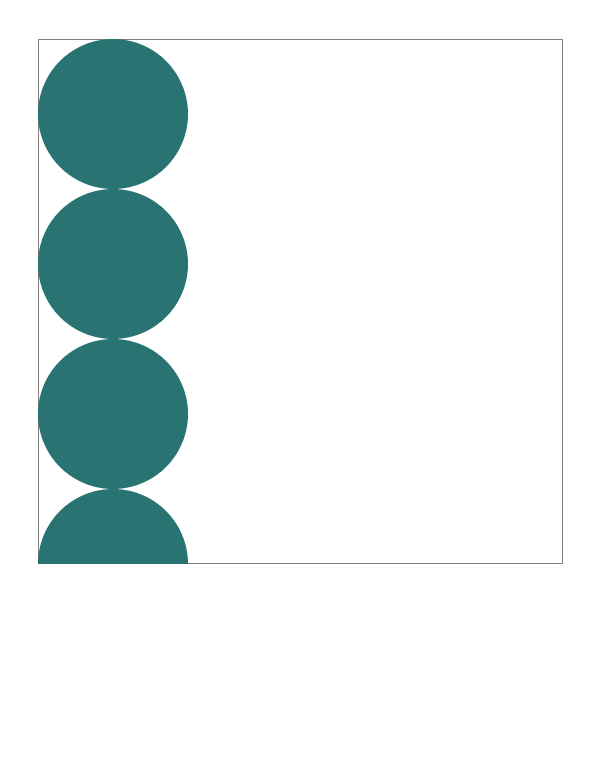
layout: root.verticalLayout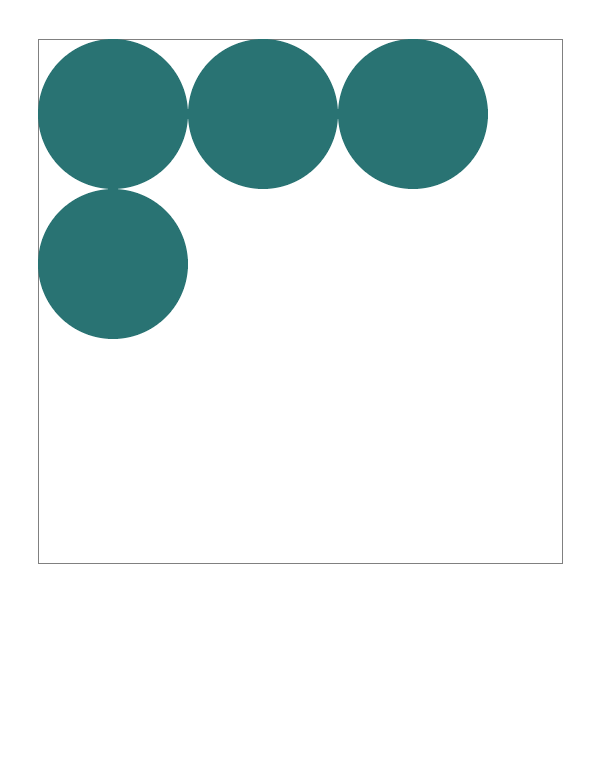
layout: root.gridLayout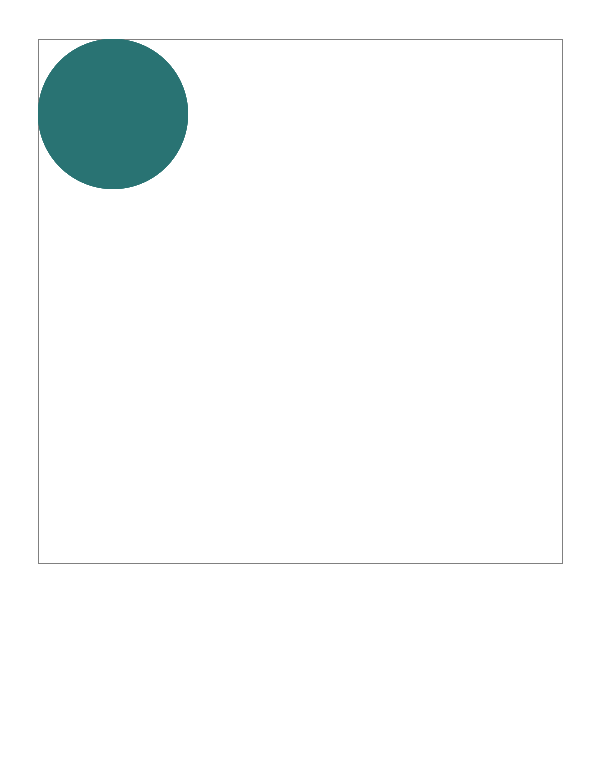
layout not set (default)See the Pen Map chart heat map by amCharts team (@amcharts) on CodePen.
Grid
Gird layout is special, because it accepts some configuration options.
Those are:
maxColumns- maximum number of columns to allow in the grid.fixedWidthGrid- if set totruewill make all columns equal in width, as opposed to best fit.
Since we don't want to modify a global instance of the grid layout (it may be used by other chart elements), we will need to create a unique instance of GridLayout specifically for the target container:
let legend = chart.children.push(am5.Legend.new(root, {
    centerX: am5.percent(50),
    x: am5.percent(50),
    layout: am5.GridLayout.new(root, {
    maxColumns: 3,
    fixedWidthGrid: true
  })
}));
var legend = chart.children.push(am5.Legend.new(root, {
    centerX: am5.percent(50),
    x: am5.percent(50),
    layout: am5.GridLayout.new(root, {
    maxColumns: 3,
    fixedWidthGrid: true
  })
}));
maxColumns: undefinedfixedWidthGrid: false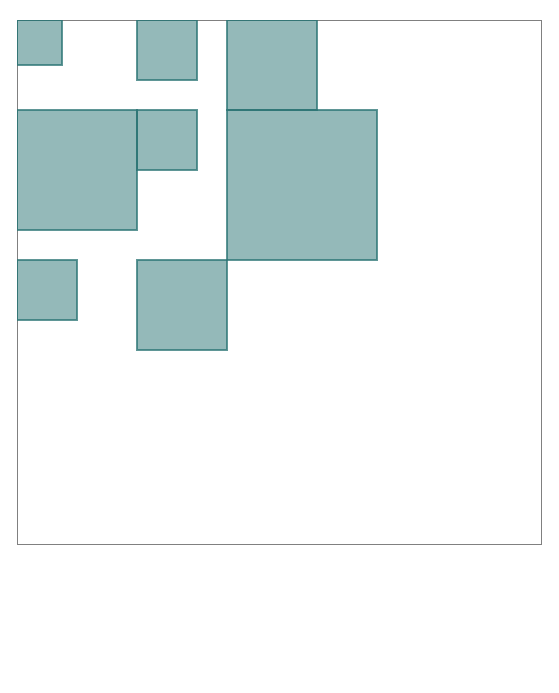
maxColumns: 3fixedWidthGrid: false 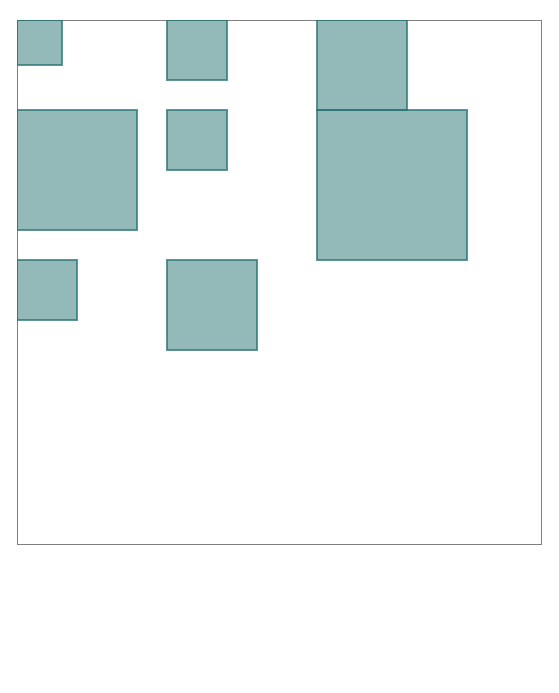
maxColumns: 3fixedWidthGrid: true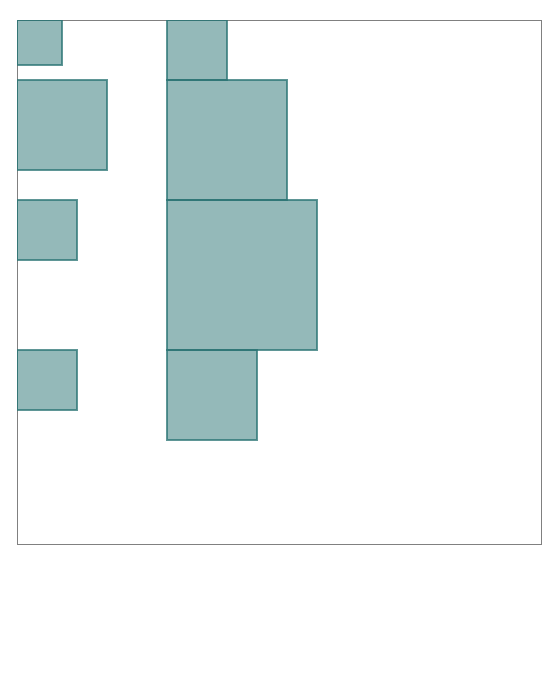
maxColumns: 2fixedWidthGrid: true See the Pen Basic containers by amCharts team (@amcharts) on CodePen.
Background
Standalone elements
Containers do not have any background by default. To add one, we will need to container's background setting to an instance of a Rectangle (or RoundedRectangle).
let chart = root.container.children.push(
  am5percent.PieChart.new(root, {
    background: am5.Rectangle.new(root, {
      fill: am5.color(0xff5599),
      fillOpacity: 0.2
    })
  })
);
var chart = root.container.children.push(
  am5percent.PieChart.new(root, {
    background: am5.Rectangle.new(root, {
      fill: am5.color(0xff5599),
      fillOpacity: 0.2
    })
  })
);
Templates
Objects like backgrounds will not be copied over to new elements from a template, so we will need to set them up using setup() method of the template:
yAxis.get("renderer").labels.template.setup = function(target) {
  target.set("background", am5.Rectangle.new(root, {
    fill: am5.color(0xff0000)
  }))
}
yAxis.get("renderer").labels.template.setup = function(target) {
  target.set("background", am5.Rectangle.new(root, {
    fill: am5.color(0xff0000)
  }))
}
IMPORTANT The template.setup needs to be set before any data is set on the the series. More info here.
Masks
Container contents can be constricted to any shape using its mask setting.
Mask can be any element of type Graphics, e.g. a Circle, Rectangle, or any custom shape.
chart.set("mask", am5.Star.new(root, {
  radius: 200,
  innerRadius: 150,
  spikes: 20,
  fill: am5.color(0x000000),
  x: am5.percent(50),
  y: am5.percent(50)
}));
chart.set("mask", am5.Star.new(root, {
  radius: 200,
  innerRadius: 150,
  spikes: 20,
  fill: am5.color(0x000000),
  x: am5.percent(50),
  y: am5.percent(50)
}));
The above will display a star-shaped pie chart:
See the Pen Pie chart by amCharts team (@amcharts) on CodePen.
Scrollbar
If container's contents do not fit into its height, we can enable scrolling by setting its verticalScrollbar instance of a Scrollbar:
var legend = chart.children.push(am5.Legend.new(root, {
  centerX: am5.percent(50),
  x: am5.percent(50),
  layout: root.verticalLayout,
  height: am5.percent(100),
  verticalScrollbar: am5.Scrollbar.new(root, {
    orientation: "vertical"
  })
}));
var legend = chart.children.push(am5.Legend.new(root, {
  centerX: am5.percent(50),
  x: am5.percent(50),
  layout: root.verticalLayout,
  height: am5.percent(100),
  verticalScrollbar: am5.Scrollbar.new(root, {
    orientation: "vertical"
  })
}));
NOTE Please note that height needs to be set for this to work properly.
See the Pen Pie chart legend alignment by amCharts team (@amcharts) on CodePen.
Zoomable container
There's also a special version of a Container: ZoomableContainer.
We can use it to make any chart content zoomable.
Creating a zoomable container
ZoomableContainer is similar to a regular Container with a couple of important restrictions:
- It needs to be a top-most child of the Root container.
- Zoomable contents must go into its
contents.childrenrather thanchildren.
let zoomableContainer = root.container.children.push(
  am5.ZoomableContainer.new(root, {
    width: am5.p100,
    height: am5.p100
  })
);

let series = zoomableContainer.contents.children.push(am5hierarchy.ForceDirected.new(root, {
  valueField: "value",
  categoryField: "name",
  childDataField: "children",
  idField: "name"
}));
var zoomableContainer = root.container.children.push(
  am5.ZoomableContainer.new(root, {
    width: am5.p100,
    height: am5.p100
  })
);

var series = zoomableContainer.contents.children.push(am5hierarchy.ForceDirected.new(root, {
  valueField: "value",
  categoryField: "name",
  childDataField: "children",
  idField: "name"
}));
Zoom functionality
Zoom in a zoomable container can be can be controlled via mouse wheel, pinch-zoom, API functions, or a zoom tools.
Both wheel and pinch-zoom are enabled by default.
To disable them, we can use wheelable and pinchZoom settings respectively:
let zoomableContainer = root.container.children.push(
  am5.ZoomableContainer.new(root, {
    width: am5.p100,
    height: am5.p100,
    wheelable: false,
    pinchZoom: false
  })
);
var zoomableContainer = root.container.children.push(
  am5.ZoomableContainer.new(root, {
    width: am5.p100,
    height: am5.p100,
    wheelable: false,
    pinchZoom: false
  })
);
Zoom tools
To add zoom tools, we can use a bundled ZoomTools class:
let zoomTools = zoomableContainer.children.push(am5.ZoomTools.new(root, {
  target: zoomableContainer
}));
var zoomTools = zoomableContainer.children.push(am5.ZoomTools.new(root, {
  target: zoomableContainer
}));
Zoom API
Finally, zoomable container provides some methods to control zoom level and position:
| Method | Comment |
|---|---|
zoomToPoint(point, zoomLevel) | Pans to specific X/Y point and zooms to specific level. |
zoomIn() | Zooms in the container. |
zoomOut() | Zooms out the container. |
goHome() | Resets containers position and zoom level to initial. |
Example
See the Pen Zoomable Force-Directed Tree by amCharts team (@amcharts) on CodePen.