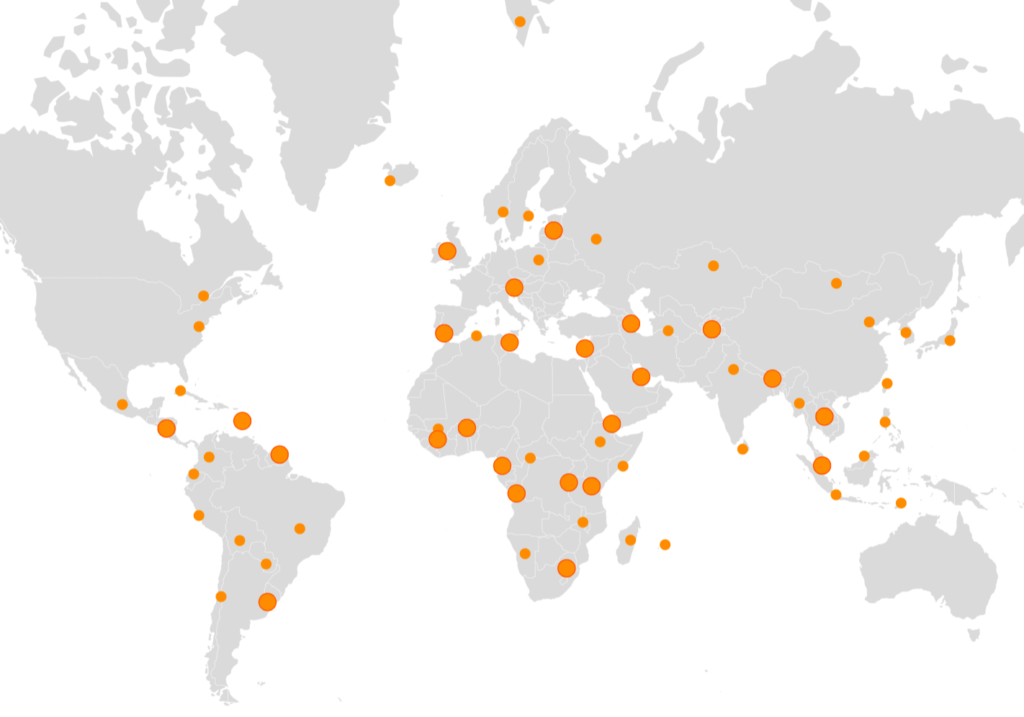
Clustered point series (ClusteredPointSeries) is basically a regular map point series (MapPointSeries) except with an added capability of automatically closely located bullets into groups, so they do not overlap.
The groups would update automatically when zooming and panning the map.
Creating series
We create clustered point series, configure itself and its bullets, set data, exactly the same way as regular map point series, except instead of using MapPointSeries class, we use ClusteredPointSeries.
let pointSeries = chart.series.push(
  am5map.ClusteredPointSeries.new(root, {
    // ...
  })
);
var pointSeries = chart.series.push(
  am5map.ClusteredPointSeries.new(root, {
    // ...
  })
);
MORE INFOPlease refer to "Map point series" documentation for info on how to configure series markers (bullets), series itself, as well as set data.
Configuring
Minimal distance
Clustered point series automatically groups bullets that are closer than 20 pixels between each other.
We can change this value using series' minDistance setting:
let pointSeries = chart.series.push(
  am5map.ClusteredPointSeries.new(root, {
    minDistance: 30
  })
);
var pointSeries = chart.series.push(
  am5map.ClusteredPointSeries.new(root, {
    minDistance: 30
  })
);
Scatter settings
When the map is nearing its maximum allowed zoom level (95% by default), all groups are exploded to reveal all bullets, even if they are located closer than minDistance.
In such case, in order for them to not overlap, they will be automatically scattered.
We can control the distance and presumed radius of such bullet so they are scattered in such a way that they do not overlap, or overlap only partially, using series settings scatterDistance and scatterRadius respectively.
We can also control the zoom point at which the scattering is applied using stopClusterZoom setting (default: 0.95).
let pointSeries = chart.series.push(
  am5map.ClusteredPointSeries.new(root, {
    minDistance: 30,
    scatterDistance: 10,
    scatterRadius: 10,
    stopClusterZoom: 0.9
  })
);
var pointSeries = chart.series.push(
  am5map.ClusteredPointSeries.new(root, {
    minDistance: 30,
    scatterDistance: 10,
    scatterRadius: 10,
    stopClusterZoom: 0.9
  })
);
Group segregation
In some cases we might want to restrict bullets to group only with a set of other bullets.
For example, we might want to force bullets from one continent to group only with bullets from the same continent.
That's where series setting groupIdField comes in.
Using it, we can specify which field on series' data holds group id.
let pointSeries = chart.series.push(
  am5map.ClusteredPointSeries.new(root, {
    groupIdField: "group"
  })
);
var pointSeries = chart.series.push(
  am5map.ClusteredPointSeries.new(root, {
    groupIdField: "group"
  })
);
Group bullet
We also need to define a special bullet to be used when several regular bullets are grouped.
It is defined like regular bullet in series, except instead of pushing it into bullets, we set it as a series' clusteredBullet setting.
As with any regular bullets, it should return a Bullet object, and can contain any visual elements.
Basic bullet
Let's start with a very basic bullet, which shows a circle:
pointSeries.set("clusteredBullet", function(root) {
  let circle = am5.Circle.new(root, {
    radius: 8,
    tooltipY: 0,
    fill: am5.color(0xff8c00)
  });

  return am5.Bullet.new(root, {
    sprite: circle
  });
});
pointSeries.set("clusteredBullet", function(root) {
  var circle = am5.Circle.new(root, {
    radius: 8,
    tooltipY: 0,
    fill: am5.color(0xff8c00)
  });

  return am5.Bullet.new(root, {
    sprite: circle
  });
});

Multi-element bullet
Bullet can contain any elements, including a Container with multiple children.
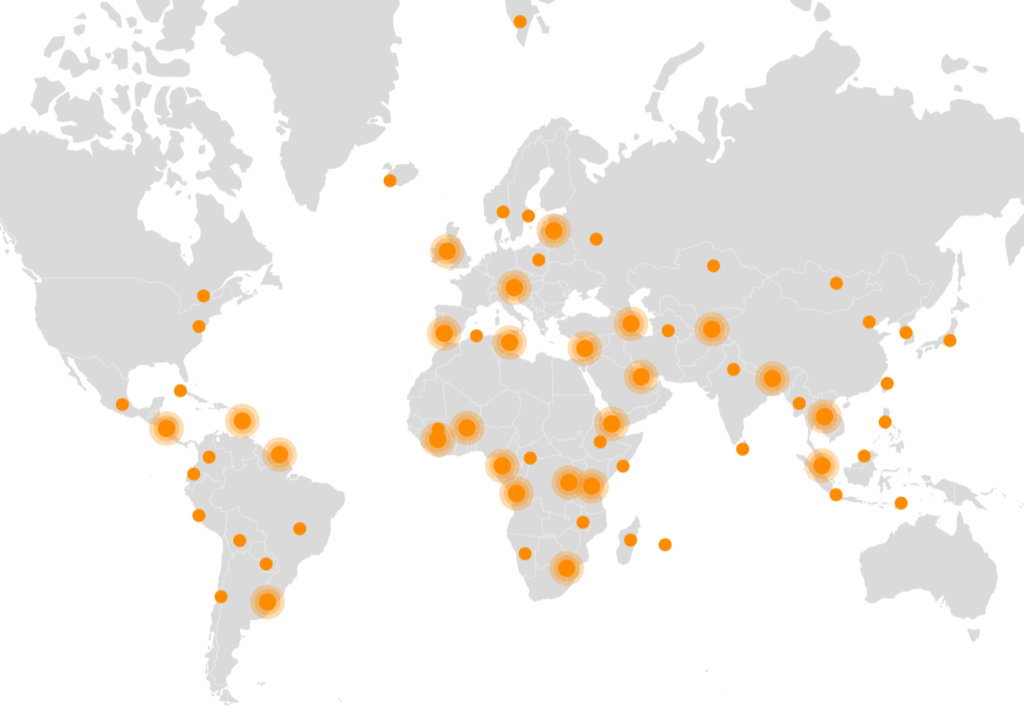
Let's enhance the bullet to use multiple concentric circles.
pointSeries.set("clusteredBullet", function(root) {
  const container = am5.Container.new(root, {
});

  const circle1 = container.children.push(am5.Circle.new(root, {
    radius: 8,
    tooltipY: 0,
    fill: am5.color(0xff8c00)
  }));

  const circle2 = container.children.push(am5.Circle.new(root, {
    radius: 12,
    fillOpacity: 0.3,
    tooltipY: 0,
    fill: am5.color(0xff8c00)
  }));

  const circle3 = container.children.push(am5.Circle.new(root, {
    radius: 16,
    fillOpacity: 0.3,
    tooltipY: 0,
    fill: am5.color(0xff8c00)
  }));

  return am5.Bullet.new(root, {
    sprite: container
  });
});
pointSeries.set("clusteredBullet", function(root) {
  var container = am5.Container.new(root, {});

  var circle1 = container.children.push(am5.Circle.new(root, {
    radius: 8,
    tooltipY: 0,
    fill: am5.color(0xff8c00)
  }));

  var circle2 = container.children.push(am5.Circle.new(root, {
    radius: 12,
    fillOpacity: 0.3,
    tooltipY: 0,
    fill: am5.color(0xff8c00)
  }));

  var circle3 = container.children.push(am5.Circle.new(root, {
    radius: 16,
    fillOpacity: 0.3,
    tooltipY: 0,
    fill: am5.color(0xff8c00)
  }));

  return am5.Bullet.new(root, {
    sprite: container
  });
});

Bullet with count
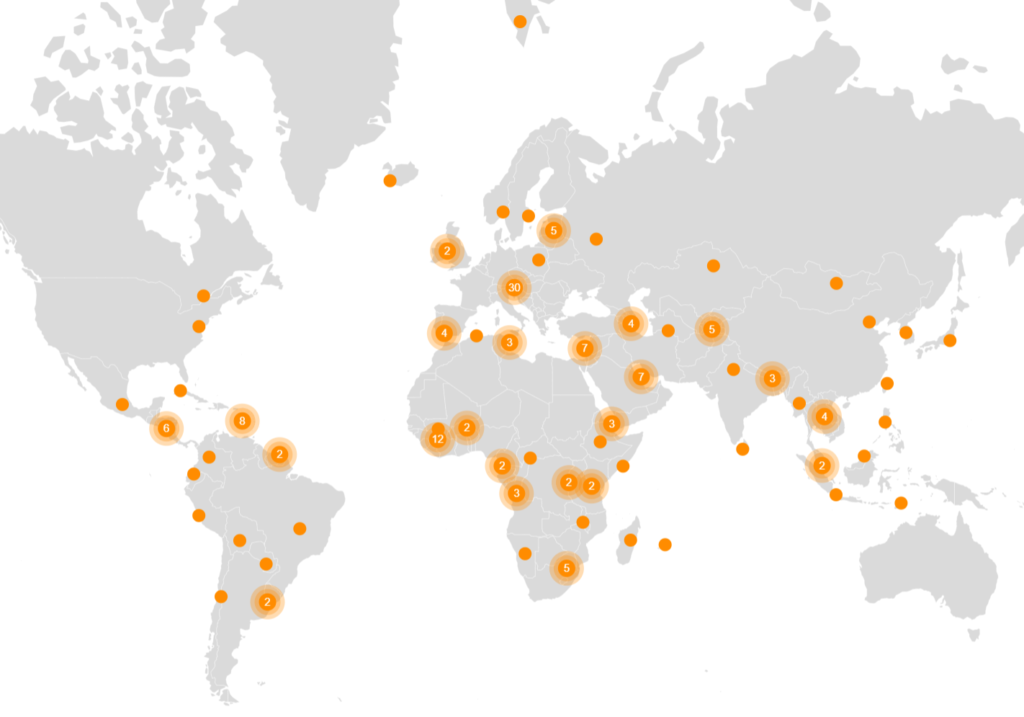
We can also add a Label element to our bullet to show the number of regular bullets that went into a group bullet.
Since every bullet element has also access to bullet's data item, we can use data placeholders to dynamically populate our label.
pointSeries.set("clusteredBullet", function(root) {
  const container = am5.Container.new(root, {});

  const circle1 = container.children.push(am5.Circle.new(root, {
    radius: 8,
    tooltipY: 0,
    fill: am5.color(0xff8c00)
  }));

  const circle2 = container.children.push(am5.Circle.new(root, {
    radius: 12,
    fillOpacity: 0.3,
    tooltipY: 0,
    fill: am5.color(0xff8c00)
  }));

  const circle3 = container.children.push(am5.Circle.new(root, {
    radius: 16,
    fillOpacity: 0.3,
    tooltipY: 0,
    fill: am5.color(0xff8c00)
  }));

  var label = container.children.push(am5.Label.new(root, {
    centerX: am5.p50,
    centerY: am5.p50,
    fill: am5.color(0xffffff),
    populateText: true,
    fontSize: "8",
    text: "{value}"
  }));

  return am5.Bullet.new(root, {
    sprite: container
  });
});
pointSeries.set("clusteredBullet", function(root) {
  var container = am5.Container.new(root, {});

  var circle1 = container.children.push(am5.Circle.new(root, {
    radius: 8,
    tooltipY: 0,
    fill: am5.color(0xff8c00)
  }));

  var circle2 = container.children.push(am5.Circle.new(root, {
    radius: 12,
    fillOpacity: 0.3,
    tooltipY: 0,
    fill: am5.color(0xff8c00)
  }));

  var circle3 = container.children.push(am5.Circle.new(root, {
    radius: 16,
    fillOpacity: 0.3,
    tooltipY: 0,
    fill: am5.color(0xff8c00)
  }));

  var label = container.children.push(am5.Label.new(root, {
    centerX: am5.p50,
    centerY: am5.p50,
    fill: am5.color(0xffffff),
    populateText: true,
    fontSize: "8",
    text: "{value}"
  }));

  return am5.Bullet.new(root, {
    sprite: container
  });
});

Drill-down
Now, let's set up drill-down, so that when you click on a group bullet, the map zooms just enough so that all elements in that group become visible separately.
For that we need to set up click event on our bullet, which would in turn invoke series' zoomToCluster() method.
zoomToCluster() method accepts group bullet's data item as a parameter.
It also has an optional second Boolean parameter, which indicates whether we want to rotate the map so that it is centered on the group.
It is recommended to use true as a second parameter on a map with Orthographic (globe) projection.
pointSeries.set("clusteredBullet", function(root) {
  const container = am5.Container.new(root, {
    cursorOverStyle:"pointer"
  });

  const circle1 = container.children.push(am5.Circle.new(root, {
    radius: 8,
    tooltipY: 0,
    fill: am5.color(0xff8c00)
  }));

  const circle2 = container.children.push(am5.Circle.new(root, {
    radius: 12,
    fillOpacity: 0.3,
    tooltipY: 0,
    fill: am5.color(0xff8c00)
  }));

  const circle3 = container.children.push(am5.Circle.new(root, {
    radius: 16,
    fillOpacity: 0.3,
    tooltipY: 0,
    fill: am5.color(0xff8c00)
  }));

  var label = container.children.push(am5.Label.new(root, {
    centerX: am5.p50,
    centerY: am5.p50,
    fill: am5.color(0xffffff),
    populateText: true,
    fontSize: "8",
    text: "{value}"
  }));

  container.events.on("click", function(e) {
    pointSeries.zoomToCluster(e.target.dataItem);
  });

  return am5.Bullet.new(root, {
    sprite: container
  });
});
pointSeries.set("clusteredBullet", function(root) {
  var container = am5.Container.new(root, {
    cursorOverStyle:"pointer"
  });

  var circle1 = container.children.push(am5.Circle.new(root, {
    radius: 8,
    tooltipY: 0,
    fill: am5.color(0xff8c00)
  }));

  var circle2 = container.children.push(am5.Circle.new(root, {
    radius: 12,
    fillOpacity: 0.3,
    tooltipY: 0,
    fill: am5.color(0xff8c00)
  }));

  var circle3 = container.children.push(am5.Circle.new(root, {
    radius: 16,
    fillOpacity: 0.3,
    tooltipY: 0,
    fill: am5.color(0xff8c00)
  }));

  var label = container.children.push(am5.Label.new(root, {
    centerX: am5.p50,
    centerY: am5.p50,
    fill: am5.color(0xffffff),
    populateText: true,
    fontSize: "8",
    text: "{value}"
  }));

  container.events.on("click", function(e) {
    pointSeries.zoomToCluster(e.target.dataItem);
  });

  return am5.Bullet.new(root, {
    sprite: container
  });
});
Examples
World map with clustered points
See the Pen Map with clustered points by amCharts team (@amcharts) on CodePen.
US map with segregated clusters by state
See the Pen US map with state-grouped clustered points by amCharts team (@amcharts) on CodePen.