Colors
Colors in amCharts 5 are represented by a Color object.
Color class also has a bunch of static methods that can be used to convert hex numbers or RGB color identifiers into proper Color objects, but the most common method is to use a standalone am5.color() function which can convert any number or string into a Color object:
series.set("fill", am5.color(0xff0000)); // set Series color to red
series2.set("fill", am5.color("#00ff00")); // set Series color to green
series.set("fill", am5.color(0xff0000)); // set Series color to red
series2.set("fill", am5.color("#00ff00")); // set Series color to green
Wherever you need to specify a color in amCharts 5 you need to pass in a Color object.
Typical settings to use colors for is fill which indicates area fill color, and stroke which indicates line or border (outline) color of the visual elements.
Text color is specified via its fill setting.
Color sets
Colors sets are basically collections of colors with ability to generate new colors according to certain rules as needed.
In most scenarios, a chart would grab next color from the color set using its next() method.
Color set has internal counter, so it will produce new color every time.
Setting own list of colors
A color set comes with a pre-defined list of colors, depending on the theme we are using (if any).
There is a number of ways to override the list as needed.
The most easiest way is to simply set its colors setting to an array of Color objects:
chart.get("colors").set("colors", [
  am5.color(0x095256),
  am5.color(0x087f8c),
  am5.color(0x5aaa95),
  am5.color(0x86a873),
  am5.color(0xbb9f06)
]);
chart.get("colors").set("colors", [
  am5.color(0x095256),
  am5.color(0x087f8c),
  am5.color(0x5aaa95),
  am5.color(0x86a873),
  am5.color(0xbb9f06)
]);
Another option is to modify default theme:
root.defaultTheme.rule("ColorSet").set("colors", [
  am5.color(0x095256),
  am5.color(0x087f8c),
  am5.color(0x5aaa95),
  am5.color(0x86a873),
  am5.color(0xbb9f06)
]);
root.defaultTheme.rule("ColorSet").set("colors", [
  am5.color(0x095256),
  am5.color(0x087f8c),
  am5.color(0x5aaa95),
  am5.color(0x86a873),
  am5.color(0xbb9f06)
]);
Obviously, creating own custom theme is also an option.
NOTESome chart types (e.g. pie chart) use colors setting on its series, rather than chart itself. In those cases you would need to use series.get("colors") to modify color list.
Interface colors
Each root element in amCharts 5 has a special version of a color set: interfaceColors.
Unlike a regular color set, it defines colors for specific purposes, rather than plain list of colors.
For example, it defines background, text, grid, and similar colors, that are used throughout chart elements and controls.
To get a color for a specific purpose, we use its get() method.
List of purposes
| Setting (purpose) | Default | Comment |
|---|---|---|
stroke | 0xe5e5e5 | Used for all line elements and outlines. |
fill | 0xf3f3f3 | Used for element fills. |
primaryButton | 0x6794dc | Primary button background color (e.g. zoom out button). |
primaryButtonHover | 0x6771dc | Primary button background when hovered. |
primaryButtonDown | 0x68dc76 | Primary button background when pressed. |
primaryButtonActive | 0x68dc76 | Primary button background when active. |
primaryButtonText | 0xffffff | Primary button text color. |
primaryButtonStroke | 0xffffff | Primary button border/outline color. |
secondaryButton | 0xd9d9d9 | Secondary button background color (e.g. scrollbar grip). |
secondaryButtonHover | 0xa3a3a3 | Secondary button background when hovered. |
secondaryButtonDown | 0x8d8d8d | Secondary button background when pressed. |
secondaryButtonActive | 0xe6e6e6 | Secondary button background when active. |
secondaryButtonText | 0x000000 | Secondary button text color. |
secondaryButtonStroke | 0xffffff | Secondary button border/outline color. |
grid | 0x000000 | Axis grid color. Also used for some other elements like, ticks, hierarchy links, etc. |
background | 0xffffff | Background color. |
alternativeBackground | 0x000000 | Alternative background. Used for chart cursor's lines, axis fills, clock hands. |
text | 0x000000 | Default color text. |
alternativeText | 0xffffff | Alternative color text. |
disabled | 0xadadad | Fill color for disabled elements. |
positive | 0x50b300 | Color to express positive value (e.g. in candlesticks). |
negative | 0xb30000 | Color to express negative value (e.g. in candlesticks). |
NOTEDefault colors may be overridden by themes.
Using interface colors
To grab a color meant for specific use, we can use get() method:
xAxis.get("renderer").labels.template.setAll({
  fill: root.interfaceColors.get("alternativeText")
});

xAxis.setAll({
  background: am5.Rectangle.new(root, {
    fill: root.interfaceColors.get("alternativeBackground"),
    fillOpacity: 0.7
  })
});
xAxis.get("renderer").labels.template.setAll({
  fill: root.interfaceColors.get("alternativeText")
});

xAxis.setAll({
  background: am5.Rectangle.new(root, {
    fill: root.interfaceColors.get("alternativeBackground"),
    fillOpacity: 0.7
  })
});
The above will use alternativeText (default: white) for X axis labels, as well as add alternativeBackground (default: black) to the whole axis.
Now, if we would also enable "Dark" theme, the labels would become black, and axis fill white, because it flips values of the alternativeText and text as well as alternativeBackground and background.
Changing interface colors
We can also modify interface colors, using set() method:
root.interfaceColors.set("grid", am5.color(0xff0000));
root.interfaceColors.set("grid", am5.color(0xff0000));
The above will make all grid lines (as well as some other elements that use grid color) to be red.
See the Pen Using interface colors by amCharts team (@amcharts) on CodePen.
Dashed lines
To make a line (stroke) dashed, we can use element's strokeDasharray setting.
It needs to be set to an array of numbers, that define dash pattern.
If it's just a single number, it will define a length of the dash and the length of the gap between them.
If there are two numbers, the first one will define length of the dash, and the second one length of the gap.
There can be multiple numbers to create more intricate patterns.
series.strokes.template.setAll({
  strokeWidth: 3,
  strokeDasharray: [10, 5, 2, 5]
});
series.strokes.template.setAll({
  strokeWidth: 3,
  strokeDasharray: [10, 5, 2, 5]
});
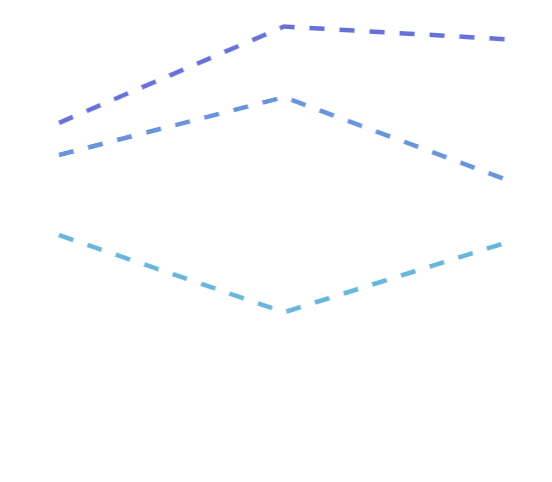
strokeDasharray: [10]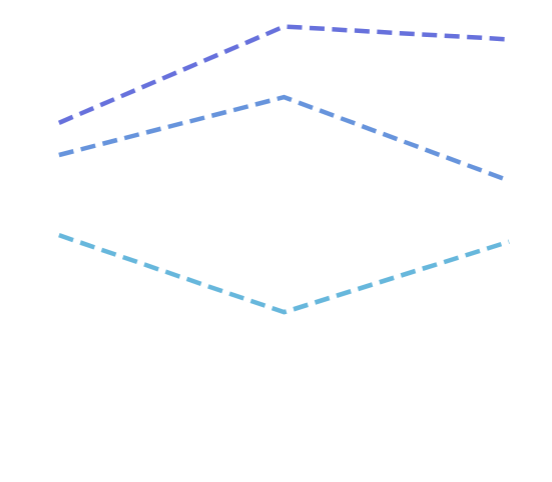
strokeDasharray: [10, 5] 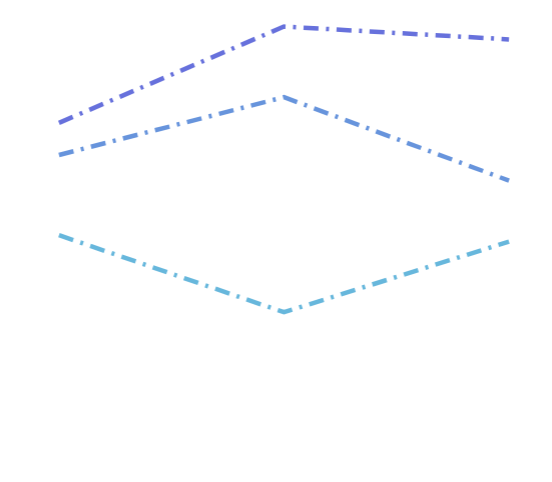
strokeDasharray: [10, 5, 2, 5] Gradients
For information on how to create gradients for fills and strokes, refer to "Gradients" tutorial.
Patterns
For information on how to create patterned fills and strokes, refer to "Patterns" tutorial.
Shadows
For information on how to enable shadows on graphic elements, refer to "Shadows" tutorial.
Filters
For information on how to apply various filters on graphic elements, refer to "Filters" tutorial.