An XY chart can be zoomed and panned in a number of ways. This tutorial takes a closer look at all of them.
Panning
An XY chart has two settings that can be used to enable panning: panX and panY.
They're both are boolean values, with true meaning that chart can be panned by dragging it horizontally (panX) and/or vertically (panY).
let chart = root.container.children.push(
  am5xy.XYChart.new(root, {
    panX: true,
    panY: false
  })
);
var chart = root.container.children.push(
  am5xy.XYChart.new(root, {
    panX: true,
    panY: false
  })
);
The above will enable horizontal panning, but will disable vertical one.
Mouse-wheel behavior
Setting behavior
Chart can also be configured to react in a number of ways to a mouse wheel.
It has two settings for that: wheelX and wheelY.
wheelX is responsible for specifying what needs to happen when mouse wheel is rotated horizontally, whereas wheelY will set action for vertical wheel rotations.
Both settings can have a number of values:
| Value | Comment |
|---|---|
"zoomX" | Zoom chart horizontally. |
"zoomY" | Zoom chart vertically. |
"zoomXY" | Zoom chart both horizontally and vertically. |
"panX" | Pan chart horizontally. |
"panY" | Pan chart vertically. |
"panXY" | Pan chart both horizontally and vertically. |
"none" (default) | Do nothing. |
The following code will set up the chart to be panned on drag, but will zoom horizontally when mouse wheel is used:
let chart = root.container.children.push(
  am5xy.XYChart.new(root, {
    panX: true,
    panY: false,
    wheelX: "zoomX"
  })
);
var chart = root.container.children.push(
  am5xy.XYChart.new(root, {
    panX: true,
    panY: false,
    wheelX: "zoomX"
  })
);
Wheel zoom center
When zooming or panning using mouse-wheel, the action will center around actual position of the mouse cursor.
We can hardcode the position using chart's wheelZoomPositionX setting (or wheelZoomPositionY for vertical whee-zooming).
It accepts numeric value from 0 (zero) to 1 (one), which indicates relative position within plot area.
E.g. the below will make chart zoom using right side of the plot area as a center:
let chart = root.container.children.push(
  am5xy.XYChart.new(root, {
    panX: true,
    panY: false,
    wheelX: "zoomX",
    wheelZoomPositionX: 1
  })
);
var chart = root.container.children.push(
  am5xy.XYChart.new(root, {
    panX: true,
    panY: false,
    wheelX: "zoomX",
    wheelZoomPositionX: 1
  })
);
Control+scroll
Enabling mouse-wheel behavior will make the chart zoom/pan but may disrupt scrolling of the whole page when mouse cursor is over the chart.
The common practice is to enable zoom/pan only when CTRL key is pressed. To implement that we can disable all wheel behavior by default, and only enable it when CTRL key is down:
chart.plotContainer.events.on("wheel", function(ev) {

  if (ev.originalEvent.ctrlKey) {
    ev.originalEvent.preventDefault();
    chart.set("wheelX", "panX");
    chart.set("wheelY", "zoomX");
  }
  else {
    chart.set("wheelX", "none");
    chart.set("wheelY", "none");
  }
});
chart.plotContainer.events.on("wheel", function(ev) {
  if (ev.originalEvent.ctrlKey) {
    ev.originalEvent.preventDefault();
    chart.set("wheelX", "panX");
    chart.set("wheelY", "zoomX");
  }
  else {
    chart.set("wheelX", "none");
    chart.set("wheelY", "none");
  }
});
See the Pen amCharts: Zooming with CTRL key and mouse wheel by amCharts team (@amcharts) on CodePen.
We can enhance this behavior with Google-like message over the chart when scroll is used without CTRL key pressed.
// Create curtain + message to show when wheel is used over chart without CTRL
let overlay = root.container.children.push(am5.Container.new(root, {
  width: am5.p100,
  height: am5.p100,
  layer: 100,
  visible: false
}));

let curtain = overlay.children.push(am5.Rectangle.new(root, {
  width: am5.p100,
  height: am5.p100,
  fill: am5.color(0x000000),
  fillOpacity: 0.3
}));


let message = overlay.children.push(am5.Label.new(root, {
  text: "Use CTRL + Scroll to zoom",
  fontSize: 30,
  x: am5.p50,
  y: am5.p50,
  centerX: am5.p50,
  centerY: am5.p50
}));

chart.plotContainer.events.on("wheel", function(ev) {
  // Show overlay when wheel is used over chart
  if (ev.originalEvent.ctrlKey) {
    ev.originalEvent.preventDefault();
    chart.set("wheelX", "panX");
    chart.set("wheelY", "zoomX");
  }
  else {
    chart.set("wheelX", "none");
    chart.set("wheelY", "none");
    overlay.show();
    overlay.setTimeout(function() {
      overlay.hide()
    }, 800);
  }
});
// Create curtain + message to show when wheel is used over chart without CTRL
var overlay = root.container.children.push(am5.Container.new(root, {
  width: am5.p100,
  height: am5.p100,
  layer: 100,
  visible: false
}));

var curtain = overlay.children.push(am5.Rectangle.new(root, {
  width: am5.p100,
  height: am5.p100,
  fill: am5.color(0x000000),
  fillOpacity: 0.3
}));

var message = overlay.children.push(am5.Label.new(root, {
  text: "Use CTRL + Scroll to zoom",
  fontSize: 30,
  x: am5.p50,
  y: am5.p50,
  centerX: am5.p50,
  centerY: am5.p50
}));

chart.plotContainer.events.on("wheel", function(ev) {
  // Show overlay when wheel is used over chart
  if (ev.originalEvent.ctrlKey) {
    ev.originalEvent.preventDefault();
    chart.set("wheelX", "panX");
    chart.set("wheelY", "zoomX");
  }
  else {
    chart.set("wheelX", "none");
    chart.set("wheelY", "none");
    overlay.show();
    overlay.setTimeout(function() {
      overlay.hide()
    }, 800);
  }
});
See the Pen amCharts: Zooming with CTRL key and mouse wheel by amCharts team (@amcharts) on CodePen.
Zooming with cursor
If an XY chart has a cursor attached to it, its behavior can be set to "zoomX", "zoomY", or "zoomXY" to zoom the chart.
chart.set("cursor", am5xy.XYCursor.new(root, {
  behavior: "zoomX"
}));
chart.set("cursor", am5xy.XYCursor.new(root, {
  behavior: "zoomX"
}));
NOTE Enabling cursor zooming will override the chart's own panX and panY settings.
Zooming with scrollbars
The chart can also be zoomed using horizontal and vertical scrollbars. Adding scrollbars to chart will automatically enable such zooming:
chart.set("scrollbarX", am5.Scrollbar.new(root, { orientation: "horizontal" }));
chart.set("scrollbarY", am5.Scrollbar.new(root, { orientation: "vertical" }));
chart.set("scrollbarX", am5.Scrollbar.new(root, { orientation: "horizontal" }));
chart.set("scrollbarY", am5.Scrollbar.new(root, { orientation: "vertical" }));
MORE INFO For more information about chart scrollbars visit "Scrollbars" tutorial.
Zooming by panning axis
It's also possible to enable axis zooming by panning it.
If enabled, user would be able to grab and drag by the axis label area to zoom it in and out.
Use axis renderer's pan setting:
let yAxis = chart.yAxes.push(
  am5xy.ValueAxis.new(root, {
    maxDeviation: 1,
    renderer: am5xy.AxisRendererY.new(root, {
      pan: "zoom"
    })
  })
);
let yAxis = chart.yAxes.push(
  am5xy.ValueAxis.new(root, {
    maxDeviation: 1,
    renderer: am5xy.AxisRendererY.new(root, {
      pan: "zoom"
    })
  })
);
See the Pen amCharts 5: Zooming by axis pan by amCharts team (@amcharts) on CodePen.
NOTEThis setting will work only with AxisRendererX and AxisRendererY. For best results use maxDeviation: 1 on your axis settings.
Pinch zoom
To enable pinch zooming of an XY chart we can use its pinchZoomX and pinchZoomY settings.
Both accept Boolean values and are set to false by default.
Setting pinchZoomX to true would enable horizontal zooming of the chart by "pinch" gesture on touch devices.
Similarly, pinchZoomY can be enabled for vertical pinch-zooming.
let chart = root.container.children.push(
  am5xy.XYChart.new(root, {
    pinchZoomX: true
  })
);
var chart = root.container.children.push(
  am5xy.XYChart.new(root, {
    pinchZoomX: true
  })
);
Over-zooming
To allow for a "bird's eye" view, a chart can zoom/pan a bit outside of the range of the actual values / axis scale.
That is controlled by axis setting maxDeviation.
With default at 0.1, it is a numeric value indicating relative distance from the whole width of the axis it can go "outside" actual data range.
For example, 0.2 will mean that we can "over-zoom" axis 20% outside its actual range.
This setting is set for each axis individually:
let xAxis = chart.xAxes.push(
  am5xy.CategoryAxis.new(root, {
    maxDeviation: 0.2,
    categoryField: "category",
    renderer: am5xy.AxisRendererX.new(root, {})
  }),
);
var xAxis = chart.xAxes.push(
  am5xy.CategoryAxis.new(root, {
    maxDeviation: 0.2,
    categoryField: "category",
    renderer: am5xy.AxisRendererX.new(root, {})
  })
);
Excluding axes from pan or zoom
We can also prevent any axis from horizontal and/or vertical zooming and/or panning using their zoomX/zoomY and panX/panY settings.
These settings accept boolean values, e.g.:
let yAxis = chart.yAxes.push(
  am5xy.ValueAxis.new(root, {
    zoomY: false,
    renderer: am5xy.AxisRendererY.new(root, {})
  })
);
var yAxis = chart.yAxes.push(
  am5xy.ValueAxis.new(root, {
    zoomY: false,
    renderer: am5xy.AxisRendererY.new(root, {})
  })
);
The following will prevent this particular Y axis to be zoomed vertically.
Limiting zoom scope
We can prevent the chart from either zooming in to deep, or zooming out too wide.
For those axes have two settings: minZoomCount and maxZoomCount.
The "count" notion differs between axis types. In data axis, it would mean number of base intervals, such as day for example. In category axis, it would mean a single category.
If minZoomCount is set, the chart will not allow zooming in the chart deeper beyond number of intervals or categories.
Similarly, if maxZoomCount is set, the chart will automatically zoom in to show only this number of intervals or categories, and will not allow zooming out further.
let xAxis = chart.xAxes.push(
  am5xy.CategoryAxis.new(root, {
    minZoomCount: 3,
    maxZoomCount: 10,
    categoryField: "category",
    renderer: am5xy.AxisRendererX.new(root, {})
  })
);
var xAxis = chart.xAxes.push(
  am5xy.CategoryAxis.new(root, {
    minZoomCount: 3,
    maxZoomCount: 10,
    categoryField: "category",
    renderer: am5xy.AxisRendererX.new(root, {})
  })
);
The above will prevent X category axis to display less than 3 or more than 10 categories at a time.
Pre-zooming axes
Relative pre-zoom
To relatively pre-zoom axis on chart init, we can use axis' settings start and end.
Those are numeric values, relative to the whole range of the axis, with 0 (zero) indicating beginning, and 1 (one) the end.
let xAxis = chart.xAxes.push(
  am5xy.DateAxis.new(root, {
    start: 0.9,
    renderer: am5xy.AxisRendererX.new(root, {})
  })
);
var xAxis = chart.xAxes.push(
  am5xy.DateAxis.new(root, {
    start: 0.9,
    renderer: am5xy.AxisRendererX.new(root, {})
  })
);
The above will pre-zoom our date axis to the last 10% percent of its scope.
NOTE If your chart has a scrollbar with the same orientation as the axis being pre-zoomed, you will need to set the same start and end values in scrollbar's settings, too.
Specific range
Each axis has its own methods for zooming to a range, suitable for units it uses.
Those methods can be executed when axis scale is ready, i.e. when its datavalidated event some series kicks.
Since most of the axes get their range based on actual data, which is set on series, hence we need to use series event for zooming axis.
series.events.on("datavalidated", function(ev) {
  // Zoom the axis
  // ...
});
series.events.on("datavalidated", function(ev) {
  // Zoom the axis
  // ...
});
For more information on zooming axes, refer to their respective tutorials:
See the Pen Data grouping by amCharts team (@amcharts) on CodePen.
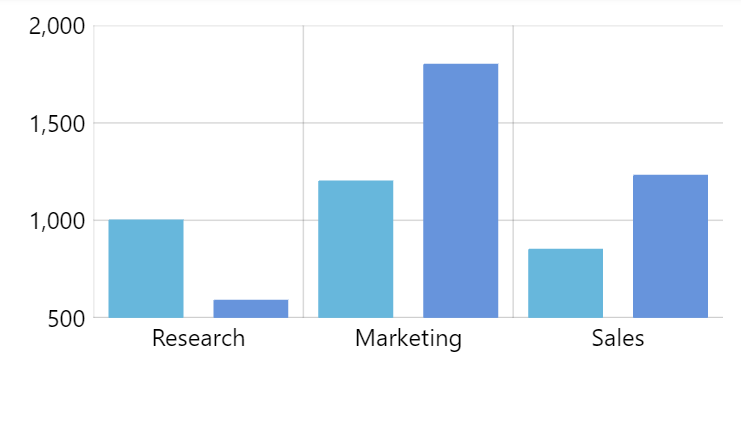
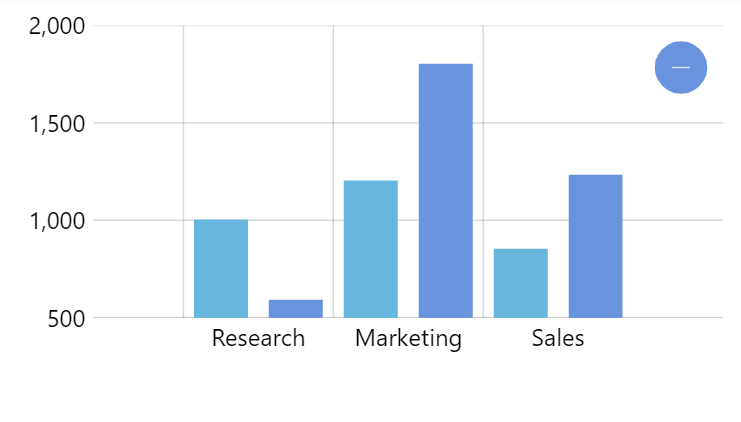
Zoom-out button
A zoom-out button appears automatically whenever chart is not ideally fully zoomed out, or is over-zoomed.
An instance of the button which is of class Button is accessible directly via chart's zoomOutButton property.
We can configure appearance using Button settings, or disable it by setting its visible to false:
chart.zoomOutButton.set("forceHidden", true);
chart.zoomOutButton.set("forceHidden", true);