Category date axis is being deprecated in favor of gapless date axis. Gapless date axis is superior to category date axis because it supports all features of a regular date axis, like period changes, data grouping, etc. This tutorial is here for legacy information for existing installs. If you are still using CategoryDateAxis, please consider switcing to GaplessDateAxis.
Category date axis (or evenly spaced date axis) is a mashup of a category axis and a date axis' features. It will display an evenly spaced cell for each entry in data. Perfect for displaying irregularly spaced time-based data, where plotting using real time scale is not important.
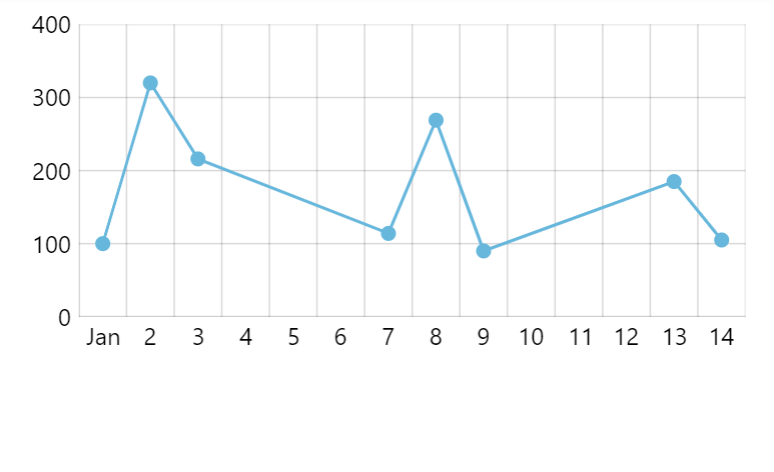
Regular date axis with irregular data 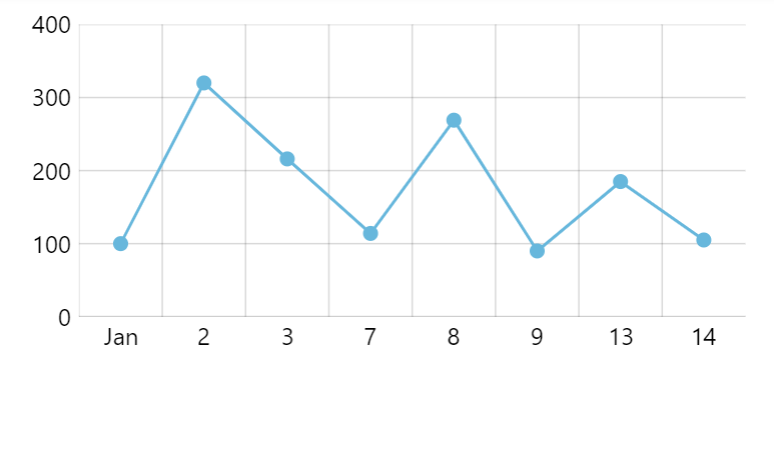
Category date axis with irregular data
Creating
Since category date axis is functionally a category axis, it needs a categoryField setting, like a regular category axis.
It also needs data set on it, which it will use to grab dates-categories from.
let xAxis = chart.xAxes.push(
  am5xy.CategoryDateAxis.new(root, {
    categoryField: "date",
    renderer: am5xy.AxisRendererX.new(root, {})
  })
);

xAxis.data.setAll(data);
var xAxis = chart.xAxes.push(
  am5xy.CategoryDateAxis.new(root, {
    categoryField: "date",
    renderer: am5xy.AxisRendererX.new(root, {})
  })
);

xAxis.data.setAll(data);
For more information on how category axis relates to its data, please refer to "Category axis" tutorial.
Data granularity
For charts with date-based data, we need to specify its granularity via axes.
Just like on a date axis, it is set via baseInterval setting:
let xAxis = chart.xAxes.push(
  am5xy.CategoryDateAxis.new(root, {
    baseInterval: { timeUnit: "day", count: 1 },
    categoryField: "date",
    renderer: am5xy.AxisRendererX.new(root, {})
  })
);
var xAxis = chart.xAxes.push(
  am5xy.CategoryDateAxis.new(root, {
    baseInterval: { timeUnit: "day", count: 1 },
    categoryField: "date",
    renderer: am5xy.AxisRendererX.new(root, {})
  })
);
For a complete description on how it works how to configure data granularity, refer to "Date axis: Data granularity".
Grid granularity
Category date axis, just like date axis, chooses where to place grid based on minGridDistance setting and available space.
For a complete description on how it works and how to configure grid granularity, refer to "Date axis: Grid granularity" tutorial.
Date formats
Labels
Labels on a category date axis are formatted based on the time unit the grid is currently at.
Format for each time unit can be formatted via dateFormats and periodChangeDateFormats settings:
xAxis.get("dateFormats")["day"] = "d";
xAxis.get("periodChangeDateFormats")["day"] = "MMM";
xAxis.get("dateFormats")["day"] = "d";
xAxis.get("periodChangeDateFormats")["day"] = "MMM";
For more information on how labels are formatted and how to configure formats, refer to "Date axis: Labels".
Axis tooltip
Axis will use the date format suitable for the granularity of the data (as set via baseInterval) for its tooltip (when used with cursor).
We can override that format using using tooltipDateFormat setting:
let xAxis = chart.xAxes.push(
  am5xy.DateAxis.new(root, {
    baseInterval: { timeUnit: "day", count: 1 },
    categoryField: "date",
    tooltipDateFormat: "MMM d, yyyy",
    renderer: am5xy.AxisRendererX.new(root, {})
  })
);
var xAxis = chart.xAxes.push(
  am5xy.DateAxis.new(root, {
    baseInterval: { timeUnit: "day", count: 1 },
    categoryField: "date",
    tooltipDateFormat: "MMM d, yyyy",
    renderer: am5xy.AxisRendererX.new(root, {})
  })
);
Zooming
Zooming to date range
We can use date axis' method zoomToDates() to zoom the axis to specific date range:
xAxis.zoomToDates(new Date(2021, 0, 1), new Date(2022, 0, 1));
xAxis.zoomToDates(new Date(2021, 0, 1), new Date(2022, 0, 1));
Pre-zooming
Once data is loaded on some series the date axis gets its scope of dates from, we can use zoomToDates to pre-zoom it to some date range:
series.events.once("datavalidated", function(ev) {
  ev.target.get("xAxis").zoomToDates(new Date(2021, 0, 1), new Date(2022, 0, 1));
});
series.events.once("datavalidated", function(ev) {
  ev.target.get("xAxis").zoomToDates(new Date(2021, 0, 1), new Date(2022, 0, 1));
});
Read more about pre-zooming using series events in "Zoom and pan: Pre-zooming axes".
Data item grouping
Category date axis does not support dynamic data item grouping.