Creating labels
To create a label, we simply call new() method on a Label class.
The following code creates a title on a chart:
chart.children.unshift(am5.Label.new(root, {
  text: "This is a chart title",
  fontSize: 25,
  fontWeight: "500",
  textAlign: "center",
  x: am5.percent(50),
  centerX: am5.percent(50),
  paddingTop: 0,
  paddingBottom: 0
}));
chart.children.unshift(am5.Label.new(root, {
  text: "This is a chart title",
  fontSize: 25,
  fontWeight: "500",
  textAlign: "center",
  x: am5.percent(50),
  centerX: am5.percent(50),
  paddingTop: 0,
  paddingBottom: 0
}));
See the Pen Stacked column chart by amCharts team (@amcharts) on CodePen.
Refer to Label settings list for more options.
In-line styling
Text within the label can be formatted using in-line style blocks: instructions enclosed in square brackets:
label.set("text", "[#888]This is gray[/]. [bold]And this is bold[/]!");
label.set("text", "[#888]This is gray[/]. [bold]And this is bold[/]!");
For more information, refer to "Text styling" tutorial.
Data placeholders
Labels that have access to actual data items (e.g. axis labels, series bullets, tooltips), can use data placeholders in curly brackets to refer to actual data.
label.set("text", "[#888]{categoryX}[/]: [bold]{valueY}[/]");
label.set("text", "[#888]{categoryX}[/]: [bold]{valueY}[/]");
For more information, refer to "Data placeholders" tutorial.
In order for data placeholders to work, labels also need to have they populateText setting set to true.
In places where labels are likely use placeholders that would already be set, e.g. in axes, tooltips, node labels, legend, etc.
Other places, like labels in bullets, will need their populateText set manually.
Oversized text
An oversized label is considered one that does not fit into its maxWidth setting, if it's set.
You can set it manually. Some elements will do it for you, like for example labels on a Treemap will have their maxWidth set automatically to the node width they're for.
MPORTANTThis setting currently does not work with RadialLabel.
Behavior
Normally, oversized labels won't do anything, they'd just go out of bounds.
We can control that using label's setting: oversizedBehavior.
xAxis.get("renderer").labels.template.setAll({
  oversizedBehavior: "truncate",
  maxWidth: 150
});
xAxis.get("renderer").labels.template.setAll({
  oversizedBehavior: "truncate",
  maxWidth: 150
});
Available values for oversizedBehavior:
| Setting value | Comment |
|---|---|
"none" | Text will be shown as is, even if it does not fit into maxWidth. |
"hide" | Label will be hidden completely if it does not fit. |
"fit" | Label will be scaled down to fit into maxWidth. |
"wrap" | Label text will be auto-wrapped into lines no longer than maxWidth. |
"wrap-no-break" | Label text will be auto-wrapped into lines to fit within maxWidth, but will not break words, which means labels can be longer than maxWidth. |
"truncate" | Label text will be truncated with an ellipsis to fit into maxWidth. |
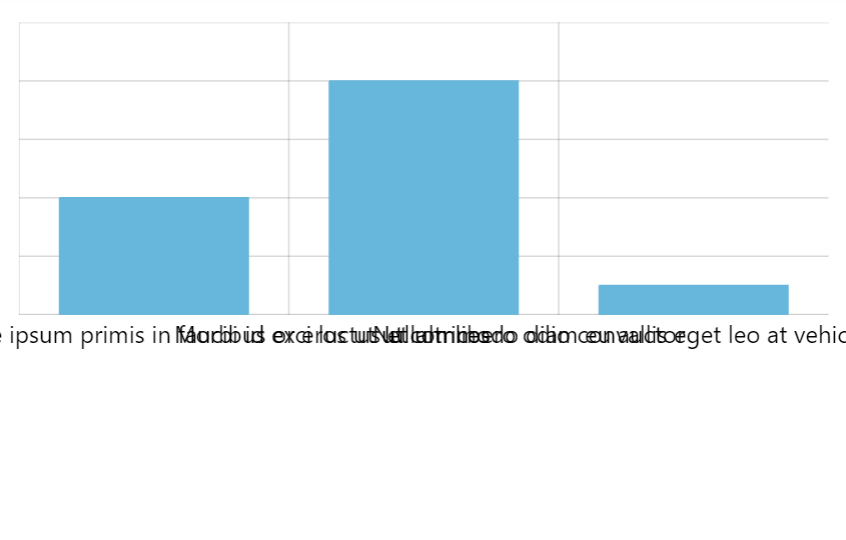
oversizedBehavior: "none" (default)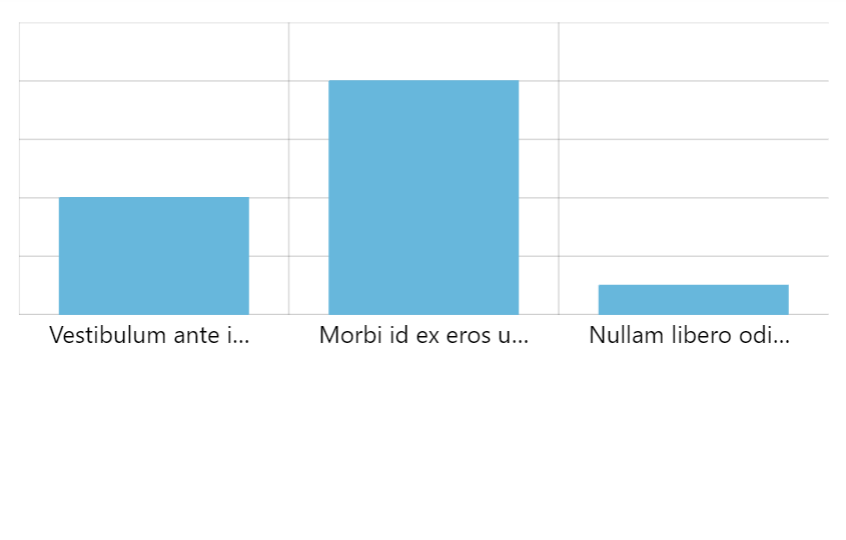
oversizedBehavior: "truncate"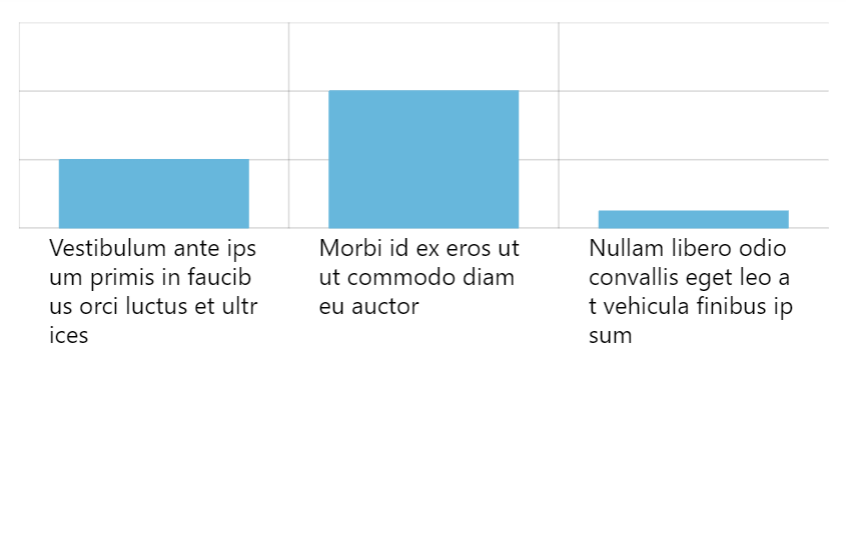
oversizedBehavior: "wrap"
oversizedBehavior: "fit"See the Pen Chart with oversized labels by amCharts team (@amcharts) on CodePen.
Rotated or vertical labels
Normally, rotated labels will still use maxWidth to apply truncation just like it was horizontal, that is not actual width of a rotated label, but its actual length.
The exception is completely vertical labels (rotation set to 90 or -90). For vertical labels, their maxHeight setting will be used instead of maxWidth.
xAxis.get("renderer").labels.template.setAll({
  oversizedBehavior: "truncate",
  maxHeight: 50,
  rotation: -90
});
xAxis.get("renderer").labels.template.setAll({
  oversizedBehavior: "truncate",
  maxHeight: 50,
  rotation: -90
});
Additional options
There are some additional options that relate to specific values of oversizedBehavior.
Additional settings for "fit"
If oversizedBehavior is set to "fit", label will try to scale down itself to fit. To avoid microscopic unreadable labels, there's another setting - minScale. If set it will not allow labels to shrink beyond certain point.
For example, if we set minScale to 0.4 label will be allowed to get to 40% of its original size. If it still doesn't fit, it will be hidden.
Some series, like force-directed and treemap, have oversizedBehavior and minScale by default.
Additional settings for "truncate"
When text is truncated, label adds a Unicode ellipsis symbol (…) at the end.
Since not all fonts support it, we might want to change it using label's ellipsis setting:
xAxis.get("renderer").labels.template.setAll({
  oversizedBehavior: "truncate",
  maxWidth: 150,
  ellipsis: "..."
});
xAxis.get("renderer").labels.template.setAll({
  oversizedBehavior: "truncate",
  maxWidth: 150,
  ellipsis: "..."
});
Line breaks
If we need a line to break in some place, all we need to do is insert a new line symbol ("\n") into text:
chart.children.unshift(am5.Label.new(root, {
  text: "This is the first line\nAnd this is the second"
}));
chart.children.unshift(am5.Label.new(root, {
  text: "This is the first line\nAnd this is the second"
}));
Alignment
Multi-line labels, or auto-wrapped labels, will align their lines to the left.
We can set labels' textAlign setting to something else, if we can them to be aligned differently:
xAxis.get("renderer").labels.template.setAll({
  oversizedBehavior: "wrap",
  maxWidth: 150,
  textAlign: "center"
});
xAxis.get("renderer").labels.template.setAll({
  oversizedBehavior: "wrap",
  maxWidth: 150,
  textAlign: "center"
});
texAlign: "left" (default)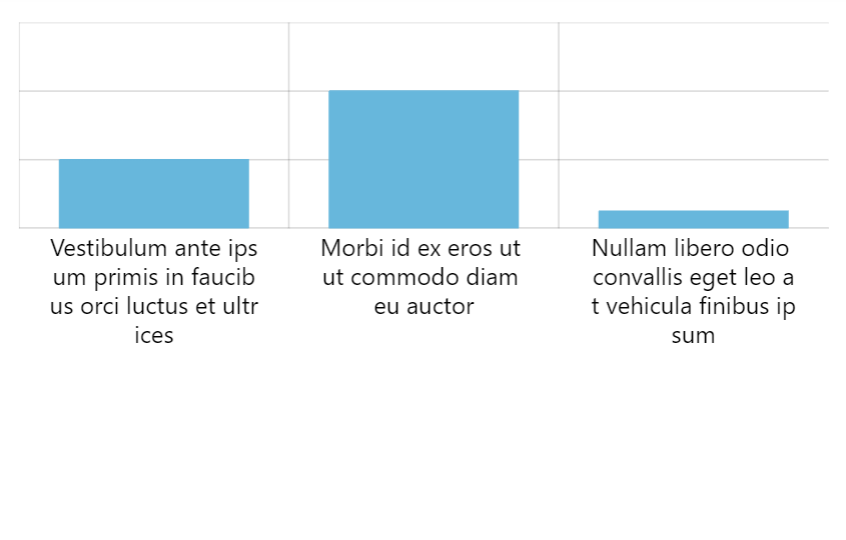
textAlign: "center"Background
Labels are containers, so can have a background. We can use its background setting for that.
For more information and examples, refer to "Containers: Background" tutorial.
Labels as interactive elements
Enabling label interactivity
Labels as interactive elements in amCharts 5 are tricky. Basically, it's super hard to determine hover/click over just text because it's impossible to completely eradicate antialising, and the actual colored area is super tiny.
Therefore, if we need tooltip to be interactive - have a hover tooltip or handle click events - we need to add a background to it.
The background does not necessarily have to be visible: we can just set its fillOpacity: 0 to make it completely transparent.
let label = chart.children.unshift(am5.Label.new(root, {
  text: "I am clickable!",
  background: am5.Rectangle.new(root, {
    fill: am5.color(0x000000),
    fillOpacity: 0
  })
}));

label.events.on("click", function(ev) {
  console.log("Clicked!");
});
var label = chart.children.unshift(am5.Label.new(root, {
  text: "I am clickable!",
  background: am5.Rectangle.new(root, {
    fill: am5.color(0x000000),
    fillOpacity: 0
  })
}));

label.events.on("click", function(ev) {
  console.log("Clicked!");
});
Label templates
For labels produces from a template (e.g. axis labels), we may need to add a "setup function" which adds a background to all newly-created labels.
yAxis.get("renderer").labels.template.setup = function(target) {
  target.set("background", am5.Rectangle.new(root, {
    fill: am5.color(0x000000),
    fillOpacity: 0
  }));
}
yAxis.get("renderer").labels.template.setup = function(target) {
  target.set("background", am5.Rectangle.new(root, {
    fill: am5.color(0x000000),
    fillOpacity: 0
  }));
}
Interactive axis labels
If we need interactivity on axis labels, we can enable them by setting interactive: true or tooltipText on a label template as well as setting up a setup function for template which adds a background, as per above code.
If we would also like to configure tooltip which is displayed, we will need to create a new Tooltip object on labels' parent, i.e. axis.labelsContainer:
xAxis.labelsContainer.set("tooltip", am5.Tooltip.new(root, {
  pointerOrientation: "down"
}));

let xRenderer = xAxis.get("renderer");

xRenderer.labels.template.setAll({
  tooltipText: "{category}",
  oversizedBehavior: "truncate",
  maxWidth: 100
});

xRenderer.labels.template.setup = function(target) {
  target.set("background", am5.Rectangle.new(root, {
    fill: am5.color(0x000000),
    fillOpacity: 0
  }));
};
xAxis.labelsContainer.set("tooltip", am5.Tooltip.new(root, {
  pointerOrientation: "down"
}));

var xRenderer = xAxis.get("renderer");

xRenderer.labels.template.setAll({
  tooltipText: "{category}",
  oversizedBehavior: "truncate",
  maxWidth: 100
});

xRenderer.labels.template.setup = function(target) {
  target.set("background", am5.Rectangle.new(root, {
    fill: am5.color(0x000000),
    fillOpacity: 0
  }));
};
See the Pen amCharts 5: Tooltips on axis labels by amCharts team (@amcharts) on CodePen.