Venn diagrams are used to depict common qualities between different items by visualizing them as overlapping circles.
Loading required modules
Everything required to create Venn diagrams are two amCharts 5 modules: "index" and "venn".
You can import those in your TypeScript / ES6 application as JavaScript modules:
import * as am5 from "@amcharts/amcharts5";
import * as am5venn from "@amcharts/amcharts5/venn";
For vanilla JavaScript applications and web pages, you can use "script" version:
<script src="https://cdn.amcharts.com/lib/5/index.js"></script>
<script src="https://cdn.amcharts.com/lib/5/venn.js"></script>
MORE INFO For more information on installing amCharts 5 as well as loading modules refer to our "Getting started" tutorial.
Venn series
Venn diagrams are chart-less. This means that rather than creating a chart element, we start by creating a series.
Adding
Like everywhere else, we use its new() method to instantiate series, then push it children of a parent container.
If we are not intending to add any other controls (e.g. legend, or title) to the chart, we can push directly to root.container.children, or we can create a wrapper container as explained later on in this tutorial.
let series = root.container.children.push(
  am5venn.Venn.new(root, {
    categoryField: "name",
    valueField: "value",
    intersectionsField: "sets"
  })
);
var series = root.container.children.push(
  am5venn.Venn.new(root, {
    categoryField: "name",
    valueField: "value",
    intersectionsField: "sets"
  })
);
Data fields
Venn diagram uses these data fields:
- Category.
- Value.
- List of overlapping categories (optional).
Data fields basically mean which keys in data objects to look for specific value.
They can be set via series' settings categoryField, valueField, and intersectionsField.
Let's take sample data:
[
  { name: "A", value: 10 },
  { name: "B", value: 8 },
  { name: "C", value: 5 },
  { name: "X", value: 2, sets: ["A", "B"] },
  { name: "Y", value: 2, sets: ["A", "C"] },
  { name: "Z", value: 2, sets: ["B", "C"] },
  { name: "Q", value: 1, sets: ["A", "B", "C"]
]
The following data fields would need to describe data fields like this:
let series = root.container.children.push(
  am5venn.Venn.new(root, {
    categoryField: "name",
    valueField: "value",
    intersectionsField: "sets"
  })
);
var series = root.container.children.push(
  am5venn.Venn.new(root, {
    categoryField: "name",
    valueField: "value",
    intersectionsField: "sets"
  })
);
Setting data
Each data item can mean either a separate category/circle or an intersection.
If there's a value in a data item for intersectionsField, the item will be an intersection. Otherwise data item will be treated as a separate circle.
The data is set directly on series via its data property:
series.data.setAll([
  { name: "A", value: 10 },
  { name: "B", value: 8 },
  { name: "C", value: 5 },
  { name: "X", value: 2, sets: ["A", "B"] },
  { name: "Y", value: 2, sets: ["A", "C"] },
  { name: "Z", value: 2, sets: ["B", "C"] },
  { name: "Q", value: 1, sets: ["A", "B", "C"]
]);
series.data.setAll([
  { name: "A", value: 10 },
  { name: "B", value: 8 },
  { name: "C", value: 5 },
  { name: "X", value: 2, sets: ["A", "B"] },
  { name: "Y", value: 2, sets: ["A", "C"] },
  { name: "Z", value: 2, sets: ["B", "C"] },
  { name: "Q", value: 1, sets: ["A", "B", "C"]
]);
IMPORTANTIt's a good practice to make sure that setting data happens as late into code as possible. Once you set data, all related objects are created, so any configuration settings applied afterwards might not carry over.
MORE INFOThere are more ways to set, update, add, or load data. For more information please refer to our dedicated "Data" tutorial.
Circles vs intersections
If data for the item contains only category and value, it will be shown as a full circle.
If there's also am array of intersecting categories (circles), it will be shown as an intersection of listed circles.
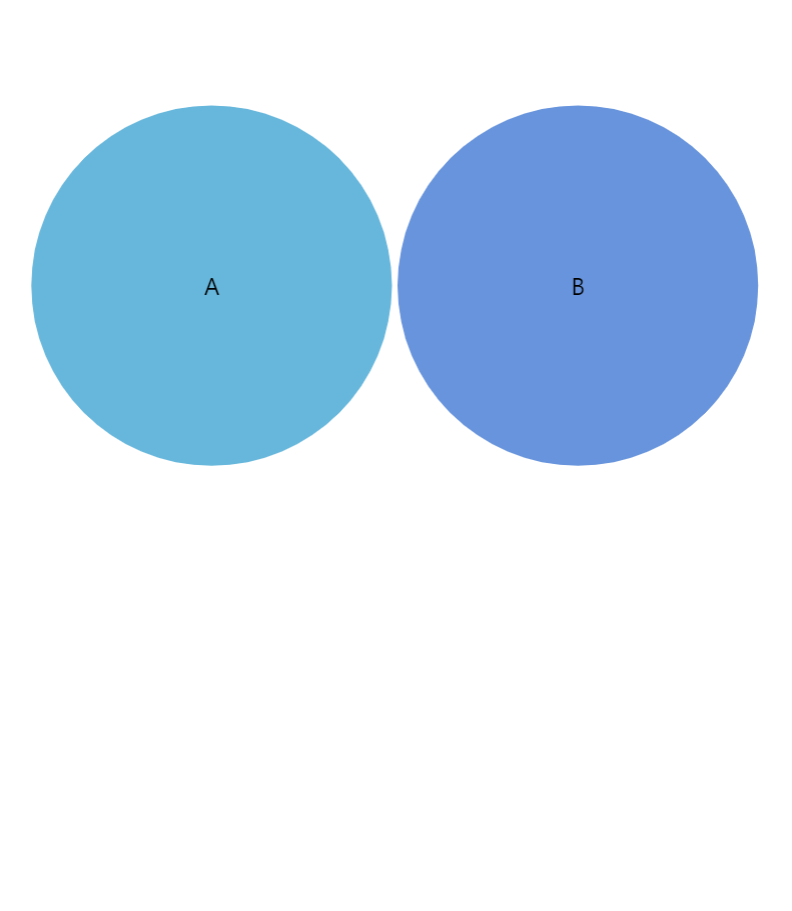
{ name: "A", value: 10 }{ name: "B", value: 10 }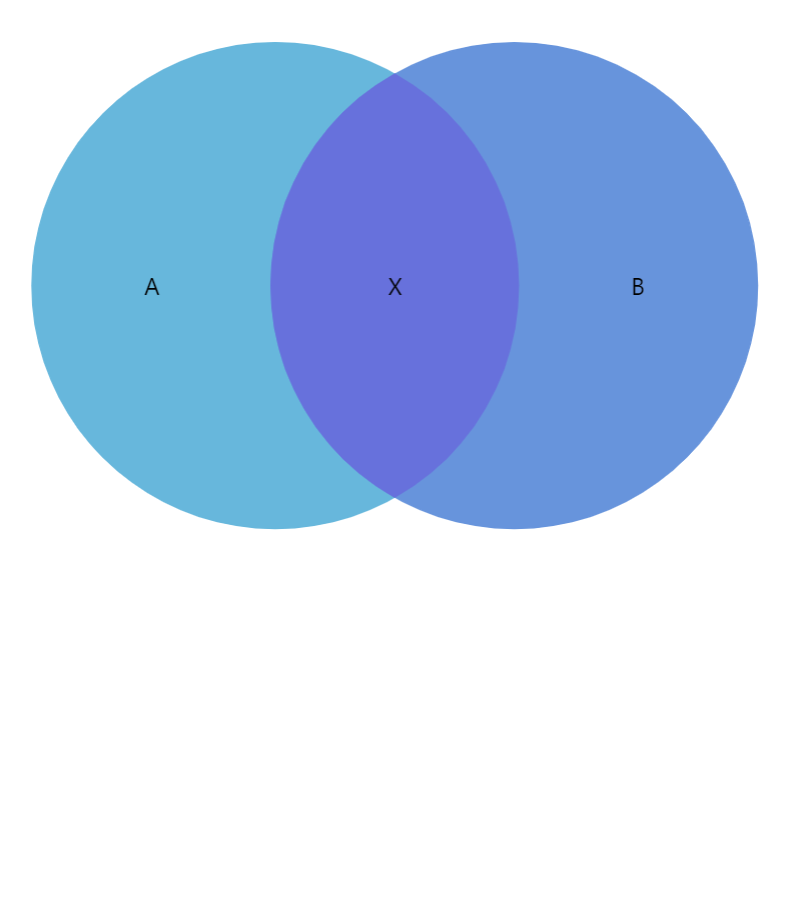
{ name: "A", value: 10 }{ name: "B", value: 10 }{ name: "X", value: 4, sets: ["A", "B"] }Let's take a look at the above two examples.
The first one defines two circles with identical values. There are no intersections defined between the two, so they are drawn as separate circles.
The second example adds an extra item in data, which defines a value for an intersection between "A" and "B". This results in proportional overlap of the two circles.
Data order
Slices are drawn in the same order as they appear in data.
This means that we need to make sure that smaller slices (especially intersections) that need to be displayed on to come last in the data, so they are not obstructed by larger chart elements.
Slices
Venn diagram consist of circles and intersections. For the sake of simplicity, let's call all of them "slices".
Colors
Slice colors are important. They identify a slice and connect it to its legend item visually.
There are a few ways to control how colors are assigned to slices.
Auto-assigned colors
A series will automatically assign a unique color to each slice from its own color set.
Should we want to, we can override the whole list of colors by either setting it directly on series color set, creating a quick theme, or a reusable full theme, e.g.:
series.get("colors").set("colors", [
  am5.color(0x095256),
  am5.color(0x087f8c),
  am5.color(0x5aaa95),
  am5.color(0x86a873),
  am5.color(0xbb9f06)
]);
series.get("colors").set("colors", [
  am5.color(0x095256),
  am5.color(0x087f8c),
  am5.color(0x5aaa95),
  am5.color(0x86a873),
  am5.color(0xbb9f06)
]);
MORE INFOA "Color sets" section of our color tutorial has more details and code samples.
Color data field
We can use Venn's setting fillField to bind slice color to a field in data.
let series = root.container.children.push(
  am5venn.Venn.new(root, {
    categoryField: "name",
    valueField: "value",
    intersectionsField: "sets",
    fillField: "color"
  })
);

series.data.setAll([
  { name: "A", value: 10, color: am5.color(0x095256) },
  { name: "B", value: 10, color: am5.color(0x087f8c) },
  { name: "X", value: 5, sets: ["A", "B"], color: am5.color(0x5aaa95) }
}]);
var series = root.container.children.push(
  am5venn.Venn.new(root, {
    categoryField: "name",
    valueField: "value",
    intersectionsField: "sets",
    fillField: "color"
  })
);

series.data.setAll([
  { name: "A", value: 10, color: am5.color(0x095256) },
  { name: "B", value: 10, color: am5.color(0x087f8c) },
  { name: "X", value: 5, sets: ["A", "B"], color: am5.color(0x5aaa95) }
}]);
Template fields
We can also specify color for each slice through data and template fields.
Template fields allow binding element's properties to an object in data:
series.slices.template.setAll({
  tooltipText: "{category}",
  templateField: "sliceSettings"
});

series.data.setAll([
  { name: "A", value: 10, sliceSettings: { fill: am5.color(0x095256) } },
  { name: "B", value: 10, sliceSettings: { fill: am5.color(0x087f8c) } },
  { name: "X", value: 5, sets: ["A", "B"], sliceSettings: { fill: am5.color(0x5aaa95) } }
}]);
For more information on how template fields work, refer to "Template fields" tutorial.
Configuring slices
Configuration of a slice is done via its template, which is accessible via series template list: series.slices.template.
We can set any setting via template:
series.slices.template.setAll({
  fillOpacity: 0.5,
  stroke: am5.color(0xffffff),
  strokeWidth: 2
});
series.slices.template.setAll({
  fillOpacity: 0.5,
  stroke: am5.color(0xffffff),
  strokeWidth: 2
});
NOTESetting a value on a template will also update existing slices created using it.
Hovers
When a slice is hovered, a special visual element is shown over it to highlight the shape of a hovered slice.
We can configure it using Venn's hoverGraphics which holds an instance of Graphics to configure its appearance.
series.hoverGraphics.setAll({
  strokeDasharray: [3, 3],
  stroke: am5.color(0xffffff),
  strokeWidth: 2
});
series.hoverGraphics.setAll({
  strokeDasharray: [3, 3],
  stroke: am5.color(0xffffff),
  strokeWidth: 2
});
The above will make the chart show a white dashed outline of the circle or intersection hovered.
Labels
Configuring labels
Label configuration is done via its template, accessible via series property labels.template.
series.labels.template.setAll({
  fontSize: 20,
  fill: am5.color(0x550000),
  text: "{category}"
});
series.labels.template.setAll({
  fontSize: 20,
  fill: am5.color(0x550000),
  text: "{category}"
});
Pie series uses Label elements for its labels. Check out its class reference for all the possible settings.
Label content
Slice labels are pre-set to display name of the category.
We can modify contents of the tooltips using text setting on a series label template:
series.labels.template.set("text", "{category}: [bold]{value}[/])");
series.labels.template.set("text", "{category}: [bold]{value}[/])");
Contents of the label can include data placeholders (codes in curly brackets that will be replaced by actual data) and in-line formatting blocks (formatting instructions enclosed in square brackets).
Disabling labels
To disable series labels, we can set forceHidden setting to true in their template:
series.labels.template.set("forceHidden", true);
series.labels.template.set("forceHidden", true);
Tooltips
Slices in a Venn diagram are pre-set to display a tooltip on hover containing name of the category value.
We can modify contents of the tooltips using tooltipText on slice's template:
series.slices.template.set("tooltipText", "{category}: [bold]{value}[/]");
series.slices.template.set("tooltipText", "{category}: [bold]{value}[/]");
Contents of the tooltip can include data placeholders (codes in curly brackets that will be replaced by actual data) and in-line formatting blocks (formatting instructions enclosed in square brackets).
Additional controls
Venn diagram is a "container-less" chart. This means that there's no wrapper "chart" element, that can be used to add series and external controls to.
If we don't need anything else besides series, we can add it directly to the container of the root element.
However, if we need to add other elements, we'll need to first create a "wrapper (or main) container", we'll be using add all the stuff (including Venn diagram itself) to:
let container = root.container.children.push(am5.Container.new(root, {
  width: am5.percent(100),
  height: am5.percent(100),
  layout: root.verticalLayout
}));

let series = root.container.children.push(
  am5venn.Venn.new(root, {
    categoryField: "name",
    valueField: "value",
    intersectionsField: "sets"
  })
);
var container = root.container.children.push(am5.Container.new(root, {
  width: am5.percent(100),
  height: am5.percent(100),
  layout: root.verticalLayout
}));

var series = root.container.children.push(
  am5venn.Venn.new(root, {
    categoryField: "name",
    valueField: "value",
    intersectionsField: "sets"
  })
);
NOTEThe layout setting of the wrapper container will determine how chart elements are laid out. For more information, refer to "Containers: Layout".
Chart title
Chart title can be added as a Label element child to the wrapper container:
let title = container.children.push(am5.Label.new(root, {
  text: "Types of coffee",
  fontSize: 20,
  x: am5.percent(50),
  centerX: am5.percent(50)
}));
var title = container.children.push(am5.Label.new(root, {
  text: "Types of coffee",
  fontSize: 20,
  x: am5.percent(50),
  centerX: am5.percent(50)
}));
Legend
To add a legend, we simply need to create an instance of a Legend class (which is a part of "index" package), push it to our wrapper container's children (or any other place we want it to be), as well as set its data (in case of a Venn diagram, we will probably want to use series data items as legend items).
let legend = container.children.push(am5.Legend.new(root, {}));
legend.data.setAll(chart.dataItems);
var legend = container.children.push(am5.Legend.new(root, {}));
legend.data.setAll(chart.dataItems);
MORE INFOFor more information on how to configure legend, its items, and layout, please visit our dedicated "Legend" tutorial.
Complete example
import * as am5 from "@amcharts/amcharts5";
import * as am5venn from "@amcharts/amcharts5/venn";

// Create root
let root = am5.Root.new("chartdiv");

// Create wrapper container
let container = root.container.children.push(
  am5.Container.new(root, {
    width: am5.p100,
    height: am5.p100,
    layout: root.verticalLayout
  })
);

// Create venn series
let series = container.children.push(
  am5venn.Venn.new(root, {
    categoryField: "name",
    valueField: "value",
    intersectionsField: "sets",
    paddingTop: 40,
    paddingBottom: 40,
    paddingLeft: 40,
    paddingRight: 40
  })
);

// Set data
series.data.setAll([
  { name: "A", value: 10 },
  { name: "B", value: 10 },
  { name: "C", value: 5 },
  { name: "X", value: 4, sets: ["A", "B"] },
  { name: "Y", value: 2, sets: ["A", "C"] },
  { name: "Z", value: 2, sets: ["B", "C"] },
  { name: "Q", value: 1, sets: ["A", "B", "C"]
}]);

// Set tooltip content
series.slices.template.set("tooltipText", "{category}: {value}");

// Set up hover appearance
series.hoverGraphics.setAll({
  strokeDasharray: [3, 3],
  stroke: am5.color(0xffffff),
  strokeWidth: 2
});

// Add legend
let legend = container.children.push(
  am5.Legend.new(root, {
    centerX: am5.p50,
    x: am5.p50
  })
);
legend.data.setAll(series.dataItems);
<script src="https://cdn.amcharts.com/lib/5/index.js"></script>
<script src="https://cdn.amcharts.com/lib/5/venn.js"></script>

<div id="chartdiv"></div>

<script>
// Create root
var root = am5.Root.new("chartdiv");

// Create wrapper container
var container = root.container.children.push(
  am5.Container.new(root, {
    width: am5.p100,
    height: am5.p100,
    layout: root.verticalLayout
  })
);

// Create venn series
var series = container.children.push(
  am5venn.Venn.new(root, {
    categoryField: "name",
    valueField: "value",
    intersectionsField: "sets",
    paddingTop: 40,
    paddingBottom: 40,
    paddingLeft: 40,
    paddingRight: 40
  })
);

// Set data
series.data.setAll([
  { name: "A", value: 10 },
  { name: "B", value: 10 },
  { name: "C", value: 5 },
  { name: "X", value: 4, sets: ["A", "B"] },
  { name: "Y", value: 2, sets: ["A", "C"] },
  { name: "Z", value: 2, sets: ["B", "C"] },
  { name: "Q", value: 1, sets: ["A", "B", "C"]
}]);

// Set tooltip content
series.slices.template.set("tooltipText", "{category}: {value}");

// Set up hover appearance
series.hoverGraphics.setAll({
  strokeDasharray: [3, 3],
  stroke: am5.color(0xffffff),
  strokeWidth: 2
});

// Add legend
var legend = container.children.push(
  am5.Legend.new(root, {
    centerX: am5.p50,
    x: am5.p50
  })
);
legend.data.setAll(series.dataItems);
</script>
See the Pen amCharts 5: Venn diagram by amCharts team (@amcharts) on CodePen.