Heat legend is a visual tool that usually compliments a chart with heat rules.
Adding
We can add a heat legend like a regular legend, by pushing and instance of HeatLegend into chart's children.
Heat legend also requires at least two settings: startColor and endColor.
Those will define colors for start (lowest value end) and end (highest value end) of the legend.
let heatLegend = chart.children.push(
  am5.HeatLegend.new(root, {
    orientation: "vertical",
    endColor: am5.color(0x661f00),
    startColor: am5.color(0xff621f)
  })
);
var heatLegend = chart.children.push(
  am5.HeatLegend.new(root, {
    orientation: "vertical",
    endColor: am5.color(0x661f00),
    startColor: am5.color(0xff621f)
  })
);
Orientation
Heat legend can either be arranged horizontally or vertically.
We can use orientation setting for that. It accepts either "vertical" or "horizontal".
Start/end labels
Legend will not show any labels by default.
If we want some labels shown at legend's ends we can use startText and endText settings:
var heatLegend = chart.children.push(
  am5.HeatLegend.new(root, {
    orientation: "vertical",
    startColor: am5.color(0xff621f),
    endColor: am5.color(0x661f00),
    startText: "Lowest",
    endText: "Highest"
  })
);
var heatLegend = chart.children.push(
  am5.HeatLegend.new(root, {
    orientation: "vertical",
    startColor: am5.color(0xff621f),
    endColor: am5.color(0x661f00),
    startText: "Lowest",
    endText: "Highest"
  })
);
If we'd like to configure the look of these two labels, we can use Label objects available in legend's startLabel and endLabel properties:
heatLegend.startLabel.setAll({
  fontSize: 12,
  fill: heatLegend.get("startColor")
});

heatLegend.endLabel.setAll({
  fontSize: 12,
  fill: heatLegend.get("endColor")
});
heatLegend.startLabel.setAll({
  fontSize: 12,
  fill: heatLegend.get("startColor")
});

heatLegend.endLabel.setAll({
  fontSize: 12,
  fill: heatLegend.get("endColor")
});
Gradient or steps
Heat legend will display a gradient along itself starting at startColor and ending with an endColor.
If we would rather it display incremental steps, we can set legend's stepCount setting.
It accepts any integer value.
var heatLegend = chart.children.push(
  am5.HeatLegend.new(root, {
    orientation: "vertical",
    startColor: am5.color(0xff621f),
    endColor: am5.color(0x661f00),
    startText: "Lowest",
    endText: "Highest",
    stepCount: 10
  })
);
var heatLegend = chart.children.push(
  am5.HeatLegend.new(root, {
    orientation: "vertical",
    startColor: am5.color(0xff621f),
    endColor: am5.color(0x661f00),
    startText: "Lowest",
    endText: "Highest",
    stepCount: 10
  })
);
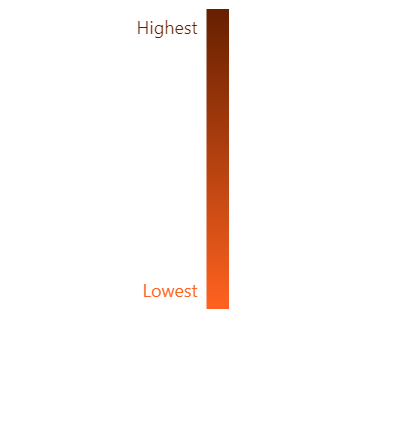
stepCount: 1 (default)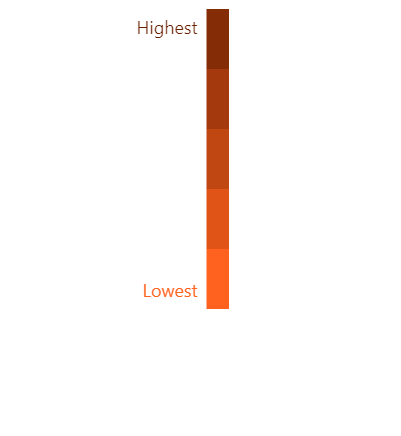
stepCount: 5
stepCount: 10Tooltip
Setting scale
In order for legend to be able to show value-sensitive tooltips, we need to assign it an actual value range using its startValue and endValue settings.
var heatLegend = chart.children.push(
  am5.HeatLegend.new(root, {
    orientation: "vertical",
    startColor: am5.color(0xff621f),
    endColor: am5.color(0x661f00),
    startValue: 0,
    endValue: 1000
  })
);
var heatLegend = chart.children.push(
  am5.HeatLegend.new(root, {
    orientation: "vertical",
    startColor: am5.color(0xff621f),
    endColor: am5.color(0x661f00),
    startValue: 0,
    endValue: 1000
  })
);
If we don't know extreme values, we can extract that from series, when its data is validated:
series.events.on("datavalidated", function () {
  heatLegend.set("startValue", series.getPrivate("valueHigh"));
  heatLegend.set("endValue", series.getPrivate("valueLow"));
});
series.events.on("datavalidated", function () {
  heatLegend.set("startValue", series.getPrivate("valueHigh"));
  heatLegend.set("endValue", series.getPrivate("valueLow"));
});
Triggering tooltip
To trigger the legend to show a tooltip at specific value, we can use its showValue() method.
heatLegend.showValue(500);
heatLegend.showValue(500);
We can also specify the optional text and color of tooltip by passing them in as a second and third parameter to showValue respectively.
heatLegend.showValue(500, "Hot!", am5.color(0xff0000));
heatLegend.showValue(500, "Hot!", am5.color(0xff0000));
We can combine this with "over" events on related series items to automatically trigger heat legend tooltip with their value:
polygonSeries.mapPolygons.template.events.on("pointerover", function(ev) {
  heatLegend.showValue(ev.target.dataItem.get("value"));
});
polygonSeries.mapPolygons.template.events.on("pointerover", function(ev) {
  heatLegend.showValue(ev.target.dataItem.get("value"));
});
Examples
Map chart
See the Pen Map chart heat map with heat legend by amCharts team (@amcharts) on CodePen.
Radar chart
See the Pen Radar chart with heat legend by amCharts team (@amcharts) on CodePen.