Flow chart
A Sankey diagram is a flow chart. For generic flow chart related information, please visit "Flow charts" tutorial.
Orientation
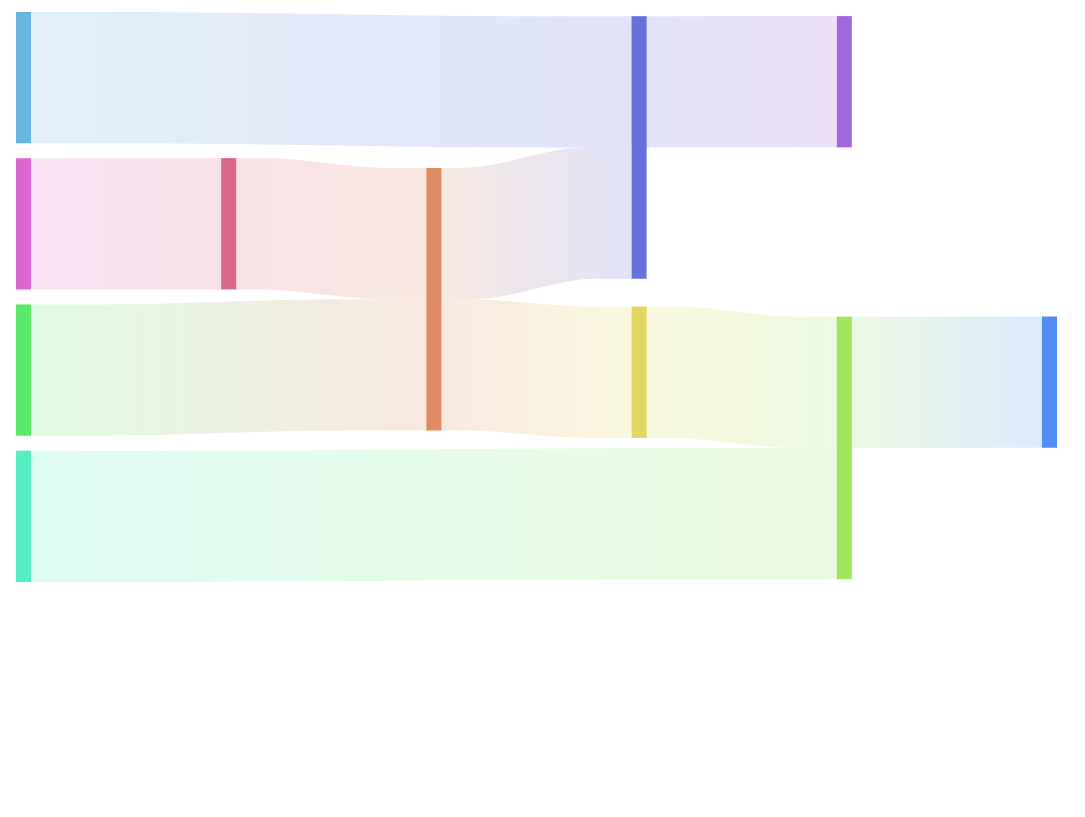
Sankey diagram is drawn horizontal (links flow from left to right) by default.
We can change it using series' orientation setting:
let series = root.container.children.push(
  am5flow.Sankey.new(root, {
    sourceIdField: "from",
    targetIdField: "to",
    valueField: "value",
    orientation: "vertical"
  })
);
var series = root.container.children.push(
  am5flow.Sankey.new(root, {
    sourceIdField: "from",
    targetIdField: "to",
    valueField: "value",
    orientation: "vertical"
  })
);
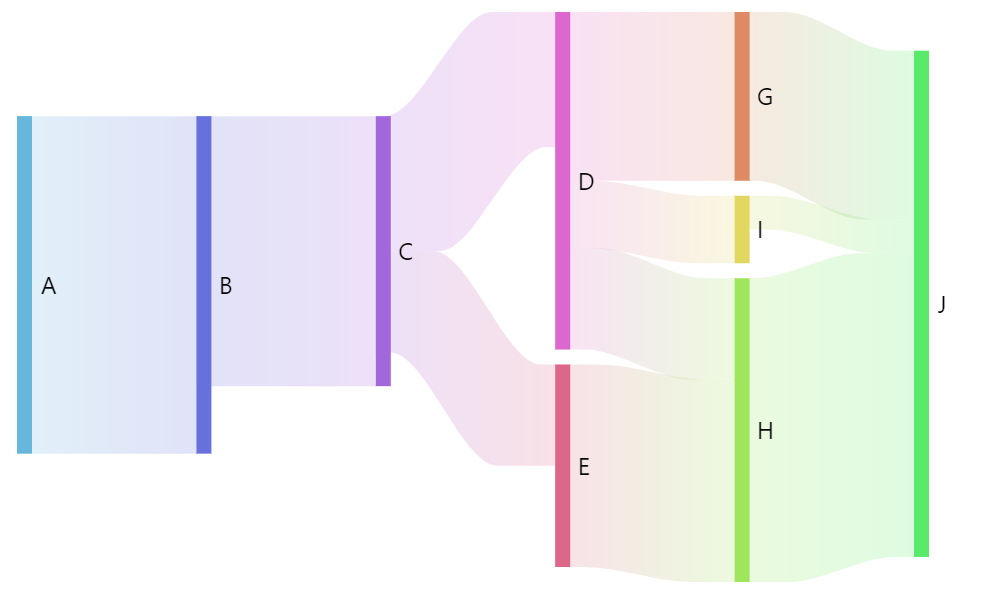
orientation: "horizontal" (default)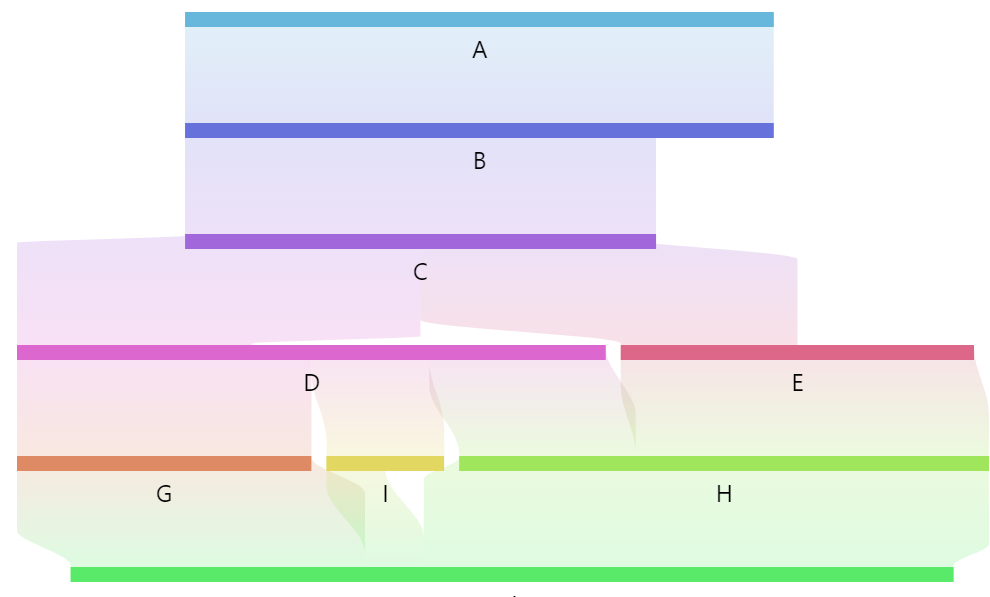
orientation: "vertical"Nodes
Width
Nodes (colored bands) are 10 pixel wide by default.
We can use series setting nodeWidth to change that:
let series = root.container.children.push(
  am5flow.Sankey.new(root, {
    sourceIdField: "from",
    targetIdField: "to",
    valueField: "value",
    nodeWidth: 5
  })
);
var series = root.container.children.push(
  am5flow.Sankey.new(root, {
    sourceIdField: "from",
    targetIdField: "to",
    valueField: "value",
    nodeWidth: 5
  })
);
nodeWidth: 10 (default)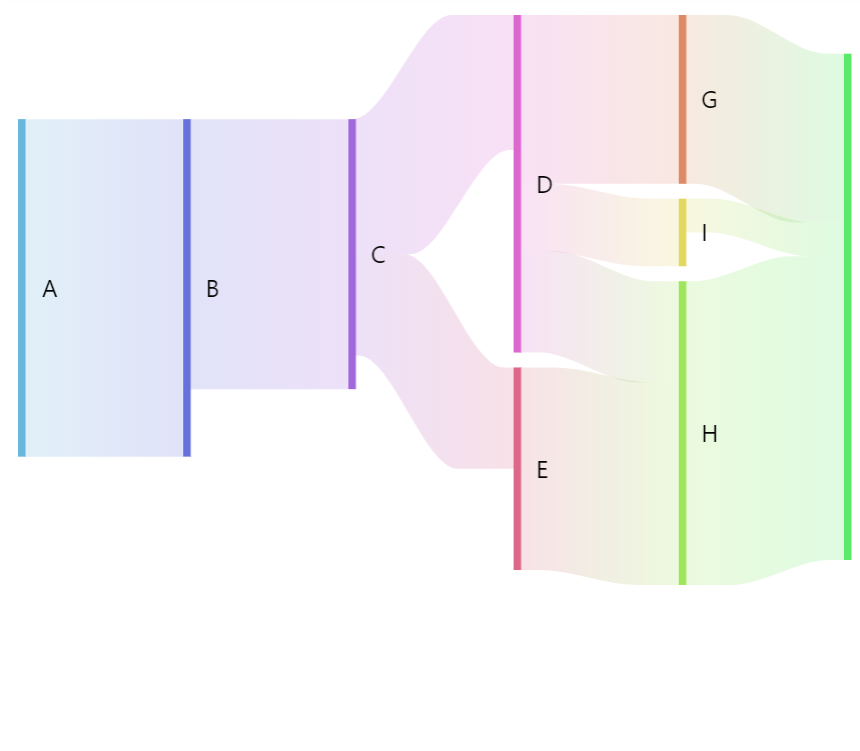
nodeWidth: 5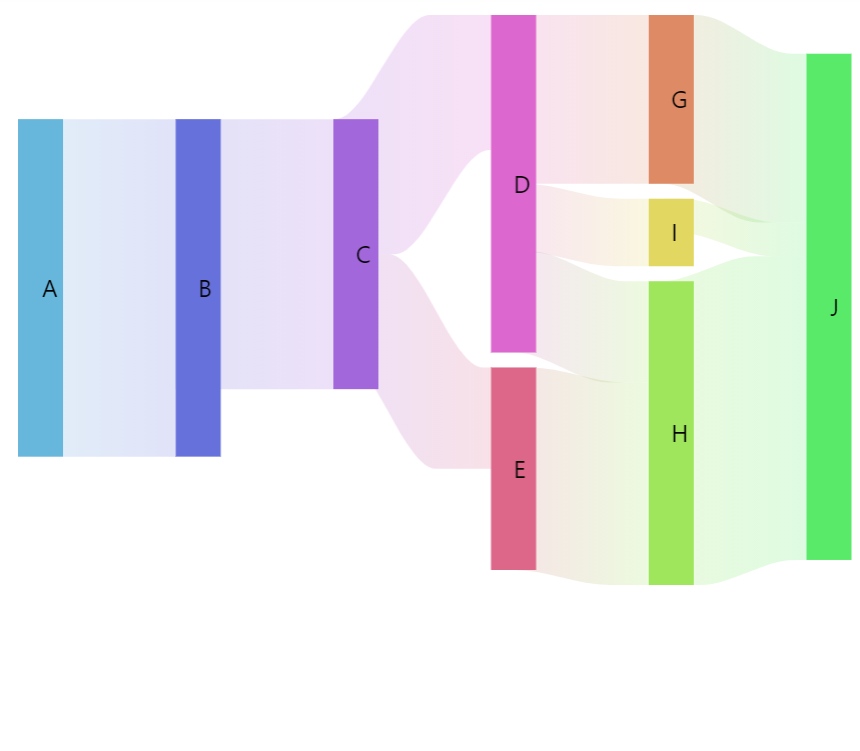
nodeWidth: 30Configuring nodes
Nodes in flow diagrams are represented by their own series, accessible via read-only property nodes which is an object of type SankeyNodes.
It subsequently has a property rectangles which is a list of all nodes in series.
Since it's a "list template", we can use its template property to set any setting for the node, which is of type RoundedRectangle:
series.nodes.rectangles.template.setAll({
  fillOpacity: 0.5,
  stroke: am5.color(0x000000),
  strokeWidth: 1,
  cornerRadiusTL: 4,
  cornerRadiusTR: 4,
  cornerRadiusBL: 4,
  cornerRadiusBR: 4
});
series.nodes.rectangles.template.setAll({
  fillOpacity: 0.5,
  stroke: am5.color(0x000000),
  strokeWidth: 1,
  cornerRadiusTL: 4,
  cornerRadiusTR: 4,
  cornerRadiusBL: 4,
  cornerRadiusBR: 4
});
See the Pen Sankey diagram by amCharts team (@amcharts) on CodePen.
Node data
Setting node data
In Sankey diagrams, node ids (and names) are derived from link data (via sourceIdField and targetIdField).
In some cases, we might need more than just node id which comes from Sankey data.
For that we can set own data on series.nodes.data:
series.nodes.data.setAll([
  { id: "A", name: "Node A" },
  { id: "B", name: "Node B" },
  { id: "C", name: "Node C" }
]);
series.nodes.data.setAll([
  { id: "A", name: "Node A" },
  { id: "B", name: "Node B" },
  { id: "C", name: "Node C" }
]);
Modifying data fields
Node series (which is SankeyNodes) is automatically set up for these data fields:
| Data field | Default value | Comment |
|---|---|---|
idField | "id" | ID of the node. |
nameField | "id" | Name of the node. |
fillField | "fill" | Fill color for the node. |
We can modify those to suit our data:
series.nodes.setAll({
  idField: "id",
  nameField: "name"
});

series.nodes.data.setAll([
  { id: "A", name: "Node A" },
  { id: "B", name: "Node B" },
  { id: "C", name: "Node C" }
]);
series.nodes.setAll({
  idField: "id",
  nameField: "name"
});

series.nodes.data.setAll([
  { id: "A", name: "Node A" },
  { id: "B", name: "Node B" },
  { id: "C", name: "Node C" }
]);
IMPORTANTData fields need to be set before data or they will not work as expected.
Node colors via data
We can also specify custom colors for nodes via node data:
series.nodes.data.setAll([
  { id: "A", name: "Node A", fill: am5.color(0xFF621F) },
  { id: "B", name: "Node B", fill: am5.color(0x297373) },
  { id: "C", name: "Node C", fill: am5.color(0x946B49) }
]);
series.nodes.data.setAll([
  { id: "A", name: "Node A", fill: am5.color(0xFF621F) },
  { id: "B", name: "Node B", fill: am5.color(0x297373) },
  { id: "C", name: "Node C", fill: am5.color(0x946B49) }
]);
The fill color will be lookup up in a "fill" field of the data. If we need to use something else, we will need to configure node series' fillField as well:
series.nodes.setAll({
  idField: "id",
  nameField: "name",
  fillField: "color"
});

series.nodes.data.setAll([
  { id: "A", name: "Node A", color: am5.color(0xFF621F) },
  { id: "B", name: "Node B", color: am5.color(0x297373) },
  { id: "C", name: "Node C", color: am5.color(0x946B49) }
]);
series.nodes.setAll({
  idField: "id",
  nameField: "name",
  fillField: "color"
});

series.nodes.data.setAll([
  { id: "A", name: "Node A", color: am5.color(0xFF621F) },
  { id: "B", name: "Node B", color: am5.color(0x297373) },
  { id: "C", name: "Node C", color: am5.color(0x946B49) }
]);
See the Pen amCharts 5: Custom Sankey node colors by amCharts team (@amcharts) on CodePen.
Gaps between nodes
Sankey diagrams display a tiny gap between each node by default.
We can control the size of it using series' nodePadding setting.
It accepts a numeric value in degrees.
let series = root.container.children.push(
  am5flow.Sankey.new(root, {
    sourceIdField: "from",
    targetIdField: "to",
    valueField: "value",
    nodePadding: 5
  })
);
var series = root.container.children.push(
  am5flow.Sankey.new(root, {
    sourceIdField: "from",
    targetIdField: "to",
    valueField: "value",
    nodePadding: 5
  })
);
nodePadding: 10 (default)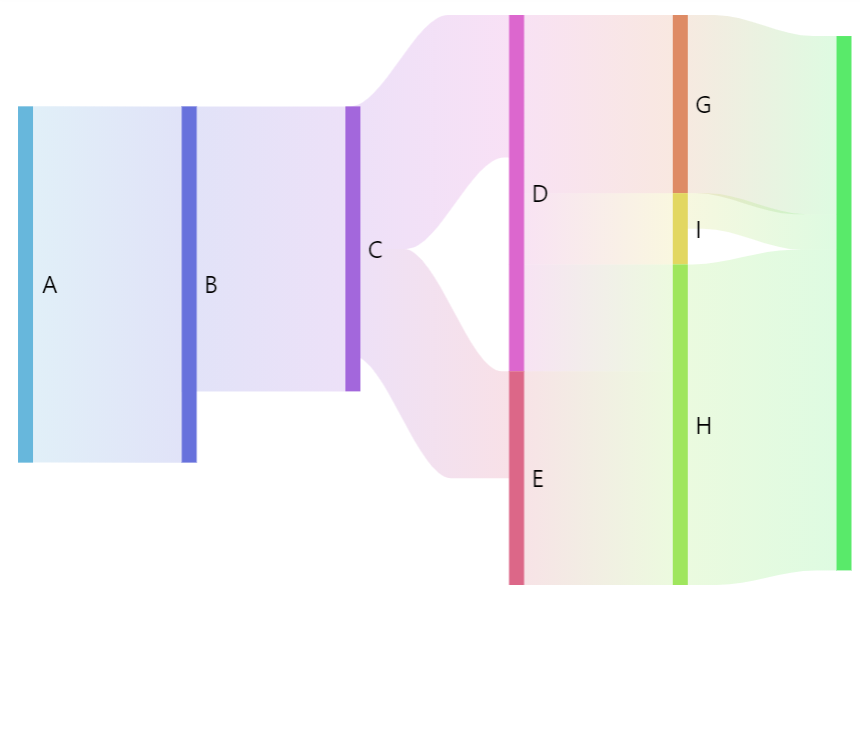
nodePadding: 0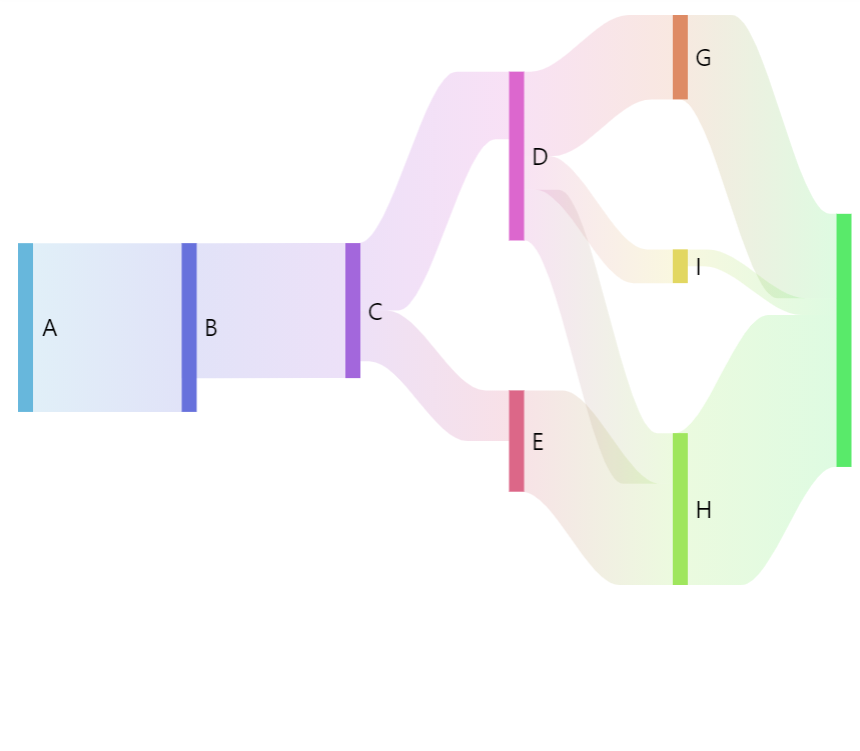
nodePadding: 100Alignment
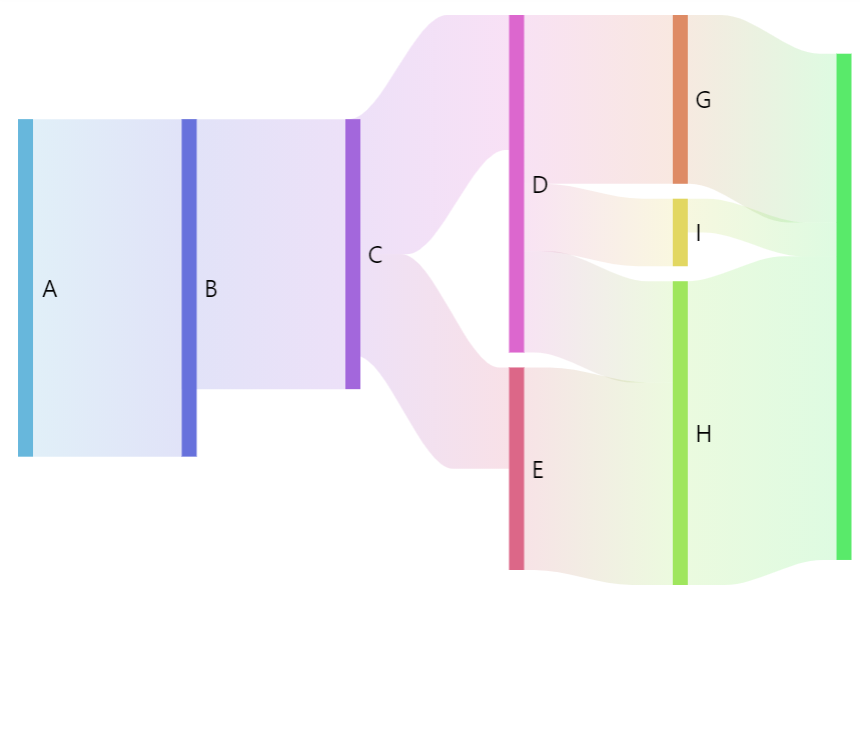
Sankey will position all of its nodes aligned to left, which might not work for complex flows.
To control it, we have a Sankey setting: nodeAlign.
It accepts four values: "left" (default), "right", "center", and "justify".
let series = root.container.children.push(
  am5flow.Sankey.new(root, {
    sourceIdField: "from",
    targetIdField: "to",
    valueField: "value",
    nodeAlign: "justify"
  })
);
var series = root.container.children.push(
  am5flow.Sankey.new(root, {
    sourceIdField: "from",
    targetIdField: "to",
    valueField: "value",
    nodeAlign: "justify"
  })
);
nodeAlign = "left" (default)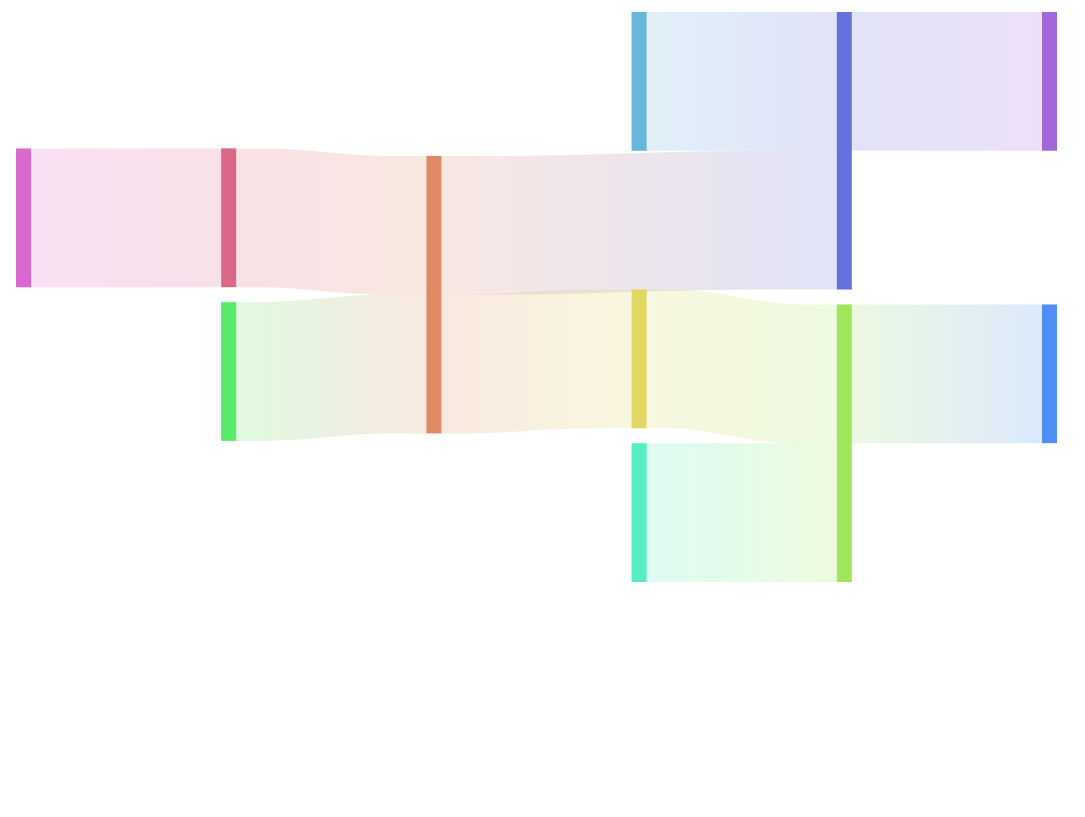
nodeAlign = "right"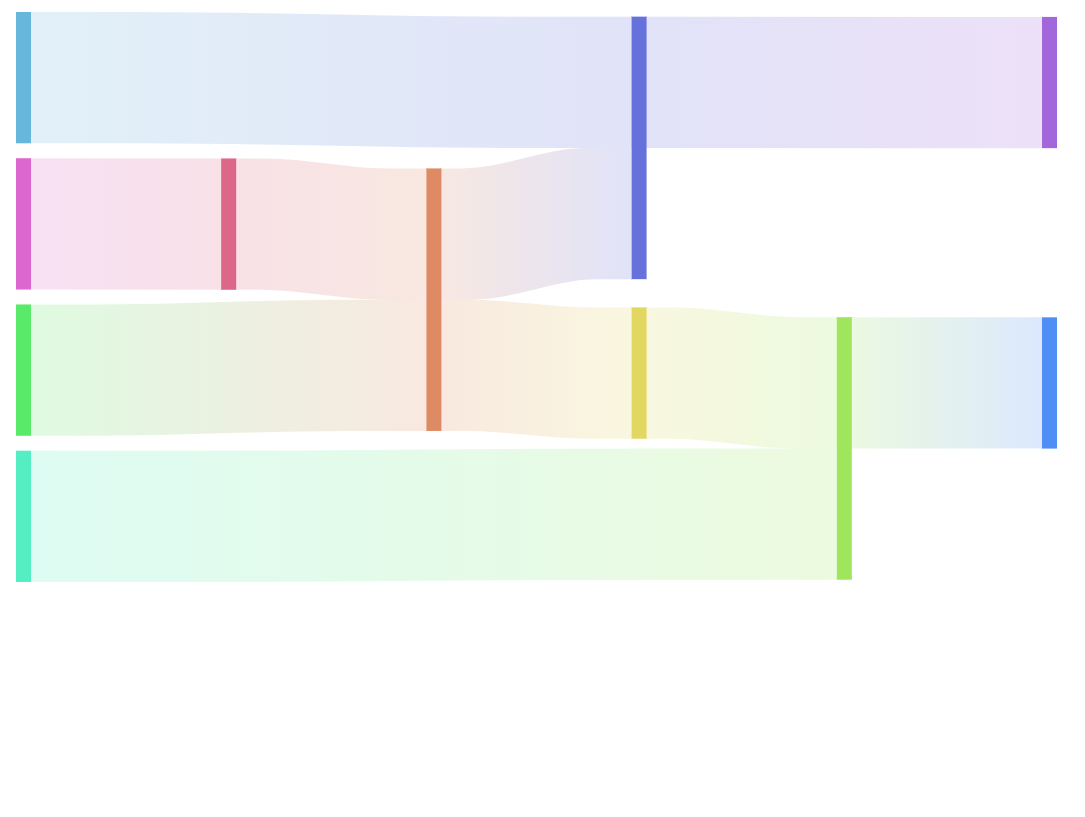
nodeAlign = "justify"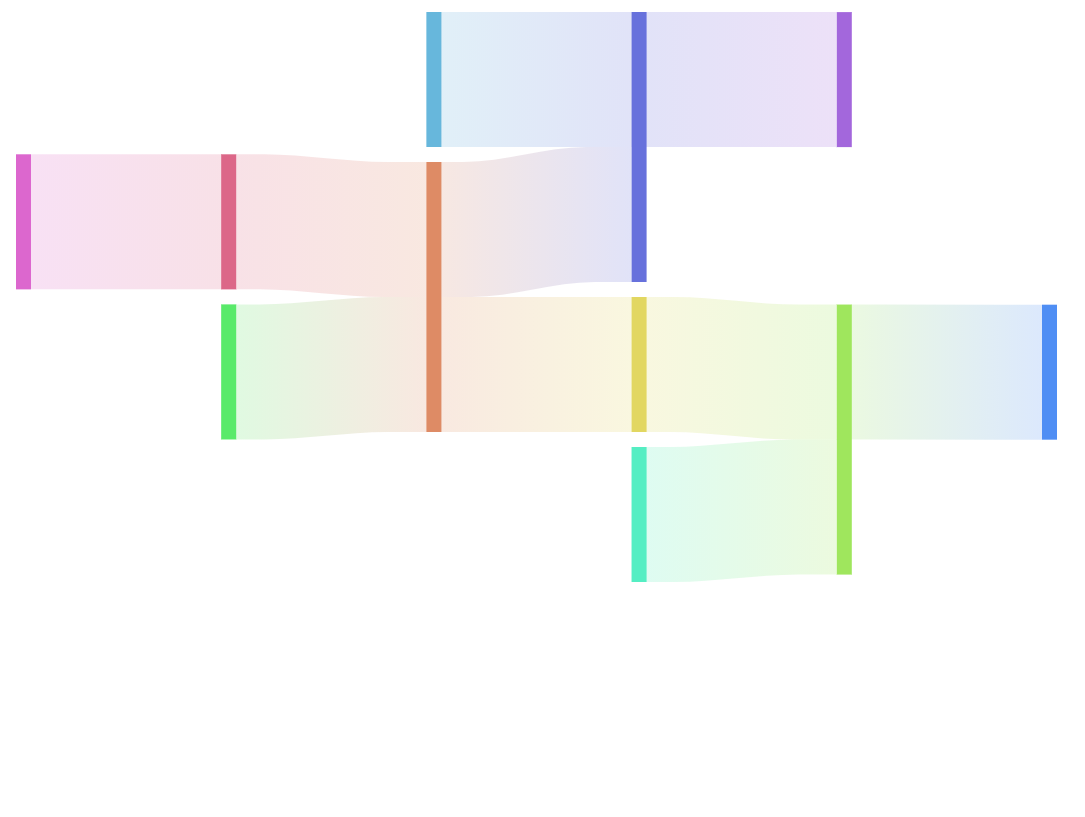
nodeAlign: "center"See the Pen Sankey diagram by amCharts team (@amcharts) on CodePen.
Disabling dragging and toggling
Nodes are draggable and click-togglable in Sankey diagram by default.
To disable it, simply set draggable: false and toggleKey: "none" settings on node template:
series.nodes.nodes.template.setAll({
  draggable: false, // disables dragging
  toggleKey: "none" // disables toggling
});
series.nodes.nodes.template.setAll({
  draggable: false, // disables dragging
  toggleKey: "none" // disables toggling
});
Links
Tension
Sankey links are smooth curves by default.
We can configure how "tight" the curve is via series linkTension setting.
With default of 0.5 it accepts a numeric value between 0 (zero) and 1 (one).
The smaller the number, the more loose the curve. 1 will result in maximum tension, i.e. perfectly straight line.
let series = root.container.children.push(
  am5flow.Sankey.new(root, {
    sourceIdField: "from",
    targetIdField: "to",
    valueField: "value",
    linkTension: 1
  })
);
var series = root.container.children.push(
  am5flow.Sankey.new(root, {
    sourceIdField: "from",
    targetIdField: "to",
    valueField: "value",
    linkTension: 1
  })
);
linkTension: 0.5 (default)
linkTension: 0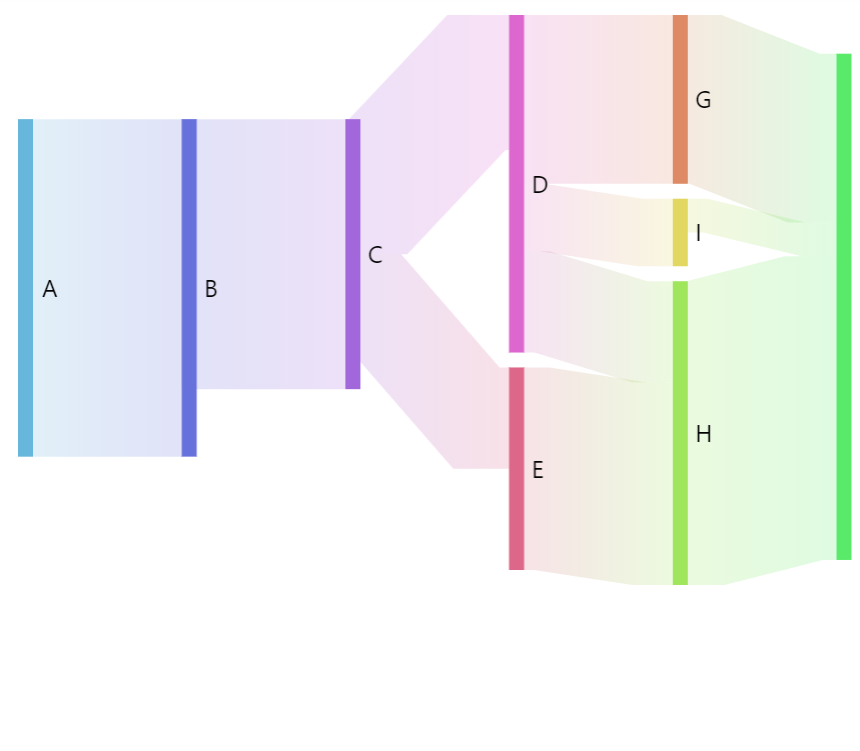
linkTension: 1Configuring links
We can configure links using series property links.template. Via template, we can set any SankeyLink setting.
series.links.template.setAll({
  fillOpacity: 0.5
});
series.links.template.setAll({
  fillOpacity: 0.5
});
Color mode
Sankey links can be colored in a number of ways via link template's fillStyle setting:
series.links.template.setAll({
  fillStyle: "solid"
});
series.links.template.setAll({
  fillStyle: "solid"
});
These values are available for fillStyle:
fillStyle | Comment | Example |
|---|---|---|
"solid" | Solid color. | 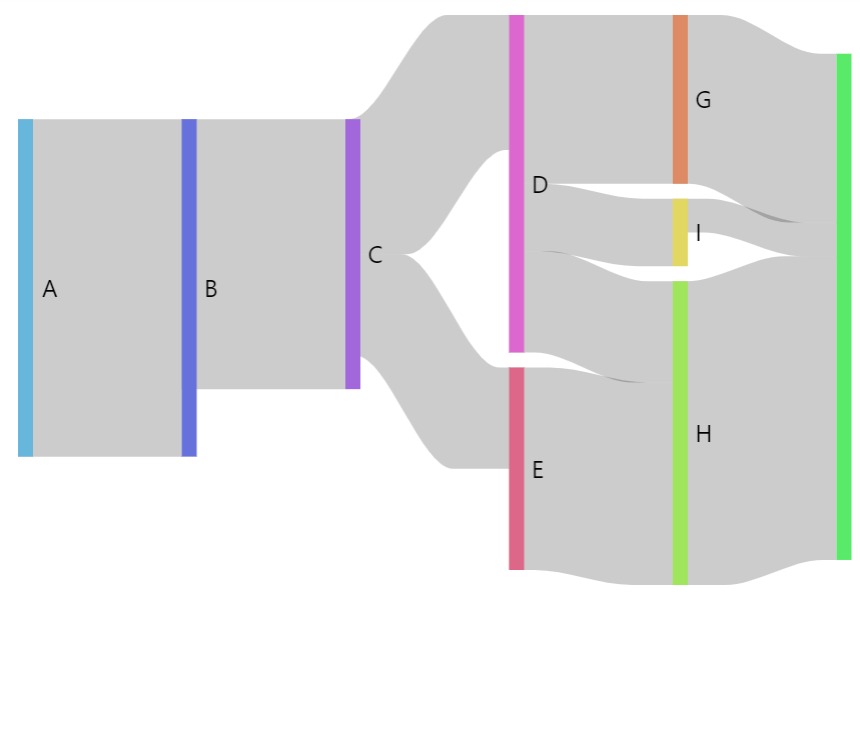 |
"gradient" (default) | Gradient from source node color to target node color. | |
"source" | Source node color. | 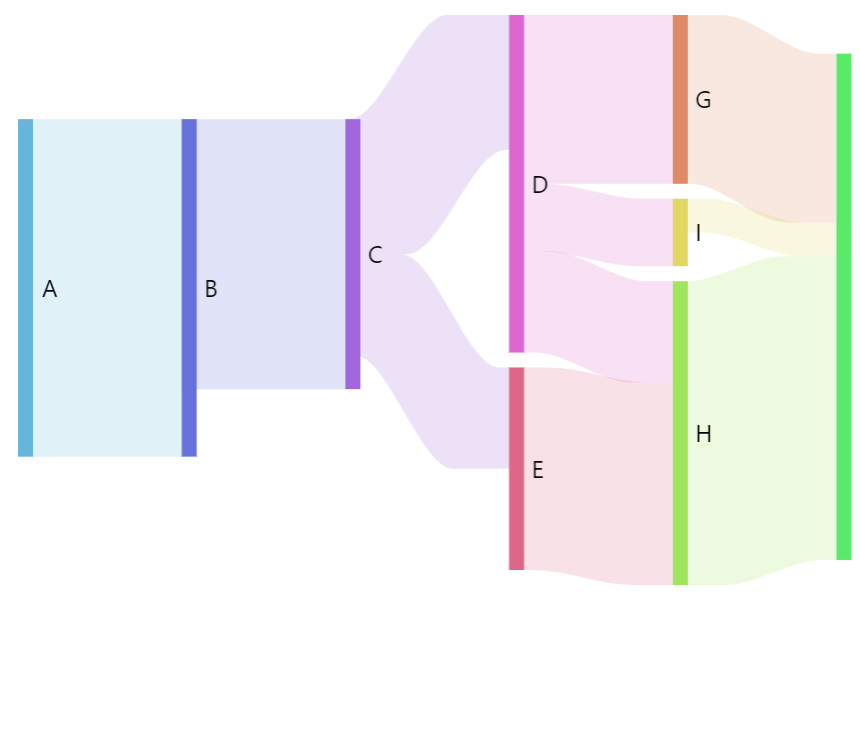 |
"target" | Target node color. | 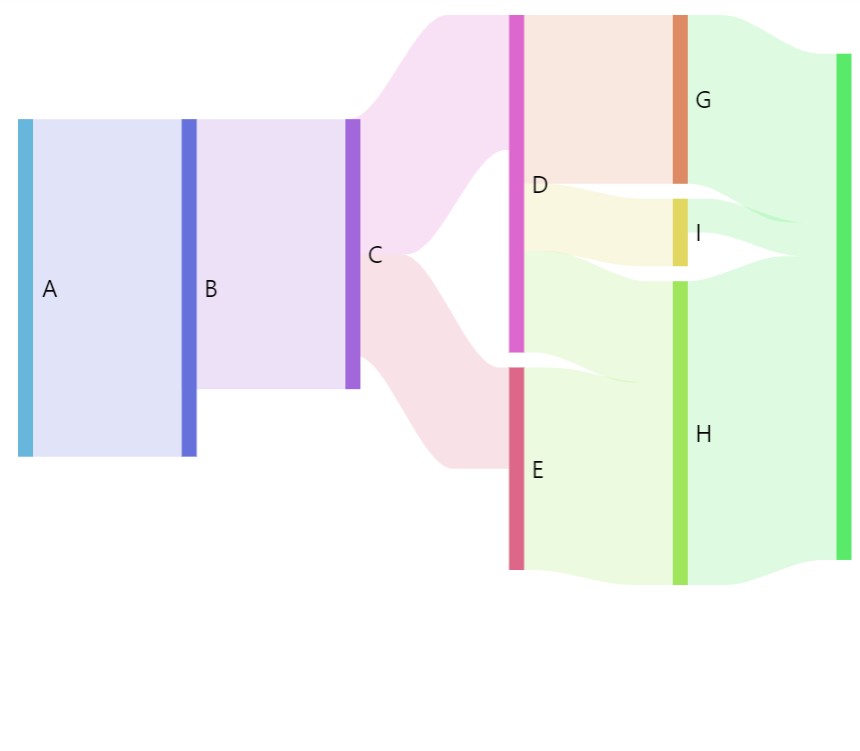 |
Bend point
A bend (or control point) is a position where link's elbows bend forming an "elbow".
By default this happens 20% of either end of the link.
We can control it using link setting: controlPointDistance.
It accepts numeric values between 0 (zero) and 1 (one). The smaller the number the closer the elbow will be to the ends of the link.
series.links.template.setAll({
  controlPointDistance: 0.4
});
series.links.template.setAll({
  controlPointDistance: 0.4
});
Link sort order
Links on a Sankey diagram are sorted using built-in fuzzy logic.
We can modify the logic using linkSort setting.
It accepts two types of values:
null. Setting it tonullwill make links appear exactly in the same order as they are set in data.function. The setting can also accept a reference to a custom function that accepts two parameters with a D3 sankey link objects.
Sorting by data
Setting linkSort to null will make the links appear in exact same order as they are defined in data:
let series = root.container.children.push(
  am5flow.Sankey.new(root, {
    sourceIdField: "from",
    targetIdField: "to",
    valueField: "value",
    linkSort: null
  })
);
var series = root.container.children.push(
  am5flow.Sankey.new(root, {
    sourceIdField: "from",
    targetIdField: "to",
    valueField: "value",
    linkSort: null
  })
);
Sorting with custom function
linkSort can also accept a reference to a custom sort function.
Similarly to JavaScript's Array.sort(a, b) function, linkSort function will receive two instances of a D3 link objects, and should return -1 if the first link should precede the second, 1 if it's the other way around, or 0 if they are both equal in priority.
let series = root.container.children.push(am5flow.Sankey.new(root, {
  sourceIdField: "from",
  targetIdField: "to",
  valueField: "value",
  paddingRight: 50,
  linkSort: function(a, b) {
    if (a.value < b.value) return -1;
    if (a.value > b.value) return 1;
    return 0;
  }
}));
var series = root.container.children.push(am5flow.Sankey.new(root, {
  sourceIdField: "from",
  targetIdField: "to",
  valueField: "value",
  paddingRight: 50,
  linkSort: function(a, b) {
    if (a.value > b.value) return -1;
    if (a.value < b.value) return 1;
    return 0;
  }
}));
The above will order all links by their value in descending order.
Labels
Sankey diagram will display a label next to its nodes by default.
Configuring labels
Labels in Sankey diagram are attached to nodes, so they can be configured via nodes sub-series, specifically nodes.labels.template:
series.nodes.labels.template.setAll({
  fontSize: 20,
  maxWidth: 150,
  oversizedBehavior: "wrap"
});
series.nodes.labels.template.setAll({
  fontSize: 20,
  maxWidth: 150,
  oversizedBehavior: "wrap"
});
Refer to Label class reference for a full list of available settings.
Label content
To change label content, we only need to set text property of the label template:
series.nodes.labels.template.setAll({
  text: "[bold]{name}[/] ({sumOutgoing})"
});
series.nodes.labels.template.setAll({
  text: "[bold]{name}[/] ({sumOutgoing})"
});
Contents of the label can include data placeholders (codes in curly brackets that will be replaced by actual data) and in-line formatting blocks (formatting instructions enclosed in square brackets).
For available data placeholder fields refer to ISankeyNodesDataItem.
Positioning labels
Labels are positioned to the right (or bottom) of the node by default.
There are a few settings that can be used to control position of the label:
| Setting key | Comment |
|---|---|
x | Horizontal position: absolute pixel values or percent relative to node height. |
y | Vertical position: absolute pixel values or percent relative to node height. |
centerX | Horizontal center of the label: absolute pixel value or percent relative to the width of the label. |
centerY | Vertical center of the label: absolute pixel value or percent relative to the width of the label. |
paddingTop | Top padding in pixels. |
paddingRight | Right padding in pixels. |
paddingBottom | Bottom padding in pixels. |
paddingLeft | Left padding in pixels. |
The below code will put labels inside and up top on the node:
series.nodes.labels.template.setAll({
  x: am5.percent(50),
  centerX: am5.percent(50),
  y: am5.percent(0),
  centerY: am5.percent(0),
  paddingLeft: 0,
  paddingRight: 0
});
series.nodes.labels.template.setAll({
  x: am5.percent(50),
  centerX: am5.percent(50),
  y: am5.percent(0),
  centerY: am5.percent(0),
  paddingLeft: 0,
  paddingRight: 0
});
See the Pen Sankey diagram by amCharts team (@amcharts) on CodePen.
MORE INFOFor selectively aligning labels, check out "Selectively positioning Sankey diagram labels".
Disabling labels
To disable labels, we can simply set their visible to false:
series.nodes.labels.template.set("visible", false);
series.nodes.labels.template.set("visible", false);
Tooltips
On links
Links will display a tooltip when hovered/touched. The default content is "{sourceId} - {targetId}: {value}" which will show source node ID, followed by target node ID, and link value.
To change it, we can use link's tooltipText setting:
series.links.template.setAll({
  tooltipText: "From: [bold]{sourceId}[/]\nTo: [bold]{targetId}\nValue: [bold]{value}[/]"
});
series.links.template.setAll({
  tooltipText: "From: [bold]{sourceId}[/]\nTo: [bold]{targetId}\nValue: [bold]{value}[/]"
});
Contents of the tooltip can include data placeholders (codes in curly brackets that will be replaced by actual data) and in-line formatting blocks (formatting instructions enclosed in square brackets).
For available data placeholder fields refer to ISankeyDataItem.
On nodes
To add tooltips to nodes, simple set tooltipText on node template:
series.nodes.rectangles.template.setAll({
  tooltipText: "[bold]{name}[/]\nOutgoing: {sumOutgoing}\nIncoming: {sumIncoming}"
});
series.nodes.rectangles.template.setAll({
  tooltipText: "[bold]{name}[/]\nOutgoing: {sumOutgoing}\nIncoming: {sumIncoming}"
});
For available data placeholder fields refer to ISankeyNodesDataItem.
Using template fields
Template fields can also be used to configure various diagram elements, such as node rectangles and link graphics.
series.nodes.rectangles.template.set("templateField", "nodeSettings");
series.links.template.set("templateField", "linkSettings");

series.nodes.data.setAll([
  { id: "A", nodeSettings: { fill: am5.color(0xFF621F), stroke: am5.color(0x000000 } },
  { id: "B", nodeSettings: { fill: am5.color(0x297373), stroke: am5.color(0x000000 } },
  { id: "C", nodeSettings: { fill: am5.color(0xFF621F), stroke: am5.color(0x000000 } },
])

series.data.setAll([
  { from: "A", to: "B", value: 10, linkSettings: { fill: am5.color(0x297373), fillOpacity: 0.5, fillStyle: "solid" } },
  { from: "B", to: "C", value: 8, linkSettings: { fill: am5.color(0xFF621F), fillOpacity: 0.5, fillStyle: "solid" } }
]);
See the Pen amCharts 5: Custom Sankey node colors by amCharts team (@amcharts) on CodePen.
NOTEFor more information on how template fields work, visit "Template fields" tutorial.