Axis ranges can be used to put lines or bands across plot area, or apply different settings to segments of series.
Creating a range
Regardless of what we are going to do use the range for (put a grid, band, label, or apply settings to series), we start off by creating it via following process:
- Create an axis data item via axis'
createDataItem()method. It will be used to specify range start (and optionally end) value/date/category as well as appearance settings for related elements like grid, fill, or label. - Create an axis range object via axis or series
createAxisRange()method using axis data item.
// Create range axis data item
let rangeDataItem = yAxis.makeDataItem({
  value: 100
});

// Create a range
let range = yAxis.createAxisRange(rangeDataItem);
// Create range axis data item
var rangeDataItem = yAxis.makeDataItem({
  value: 100
});

// Create a range
var range = yAxis.createAxisRange(rangeDataItem);
NOTEcreateAxisRange() creates the necessary range elements such as grid, labels, and fill, and returns the same data item passed in to it.
Range start and end
In the above example we've set a single setting on our range data item: value.
On a value axis it would mean that the range will start ant end at the same value, displaying single grid line.
If we would like the range to span a range of values, we would also need to set endValue:
let rangeDataItem = yAxis.makeDataItem({
  value: 100,
  endValue: 200
});
var rangeDataItem = yAxis.makeDataItem({
  value: 100,
  endValue: 200
});
Depending on the axis type, we may need to use different settings keys:
| Axis type | Start/end key usage |
|---|---|
ValueAxis | { value: 100, endValue: 200} |
DateAxis | { value: new Date(2021, 0, 1).getTime(), endValue: new Date(2021, 0, 15).getTime()} |
CategoryAxis | { category: "Q2", endCategory: "Q3"} |
CategoryDateAxis | { category: new Date(2021, 0, 1).getTime(), endCategory: new Date(2021, 0, 15).getTime()} |
Here's how it might look on a date axis:
var rangeDataItem = xAxis.makeDataItem({
  value: new Date(2021, 0, 1).getTime(),
  endValue: new Date(2021, 0, 15).getTime()
});
var rangeDataItem = xAxis.makeDataItem({
  value: new Date(2021, 0, 1).getTime(),
  endValue: new Date(2021, 0, 15).getTime()
});
Range elements
Grid
The axis data item has a setting grid which holds an instance of Grid element, that we can use to configure how the grid line (which is placed at precisely at value or category) looks like:
rangeDataItem.get("grid").setAll({
  stroke: color,
  strokeOpacity: 1
});
rangeDataItem.get("grid").setAll({
  stroke: color,
  strokeOpacity: 1
});
Grid line is placed on a start value/category by default.
We can change that using grid's location setting which is a numeric value from 0 (zero) to 1 (one) indicating relative position between start and end values.
rangeDataItem.get("grid").setAll({
  stroke: color,
  strokeOpacity: 1,
  location: 0.5
});
rangeDataItem.get("grid").setAll({
  stroke: color,
  strokeOpacity: 1,
  location: 0.5
});
The above will place grid line exactly in the middle of the range.

location: 0 (default)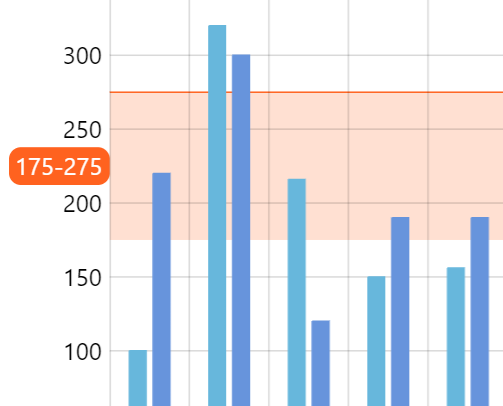
location: 1
location: 0.5If we don't need axis range to show any grid line, we can simply disable it via visible setting:
rangeDataItem.get("grid").set("visible", false);
rangeDataItem.get("grid").set("visible", false);
Fill
Unlike grid, fills are not visible by default, so we need to configure them using axisFill setting, which is a generic object of type Graphics.
rangeDataItem.get("axisFill").setAll({
  fill: color,
  fillOpacity: 0.2,
  visible: true
});
rangeDataItem.get("axisFill").setAll({
  fill: color,
  fillOpacity: 0.2,
  visible: true
});
NOTEAxis fills are hidden by default, hence the need for visible: true.
Label
Like grid and fill, a label is already pre-created with every axis data item. It's accessible via label setting and is usually an object of type AxisLabel.
For it to become visible, at the very least we need to set its text setting, but can also use any AxisLabel setting:
rangeDataItem.get("label").setAll({
  fill: am5.color(0xffffff),
  text: "Buy",
  background: am5.RoundedRectangle.new(root, {
    fill: color
  })
});
rangeDataItem.get("label").setAll({
  fill: am5.color(0xffffff),
  text: "Buy",
  background: am5.RoundedRectangle.new(root, {
    fill: color
  })
});
Similarly to grid, it also supports location setting, which can be used to position it within value range of the axis range:
rangeDataItem.get("label").setAll({
  fill: am5.color(0xffffff),
  text: "Buy",
  location: 1,
  background: am5.RoundedRectangle.new(root, {
    fill: color
  })
});
rangeDataItem.get("label").setAll({
  fill: am5.color(0xffffff),
  text: "Buy",
  location: 1,
  background: am5.RoundedRectangle.new(root, {
    fill: color
  })
});
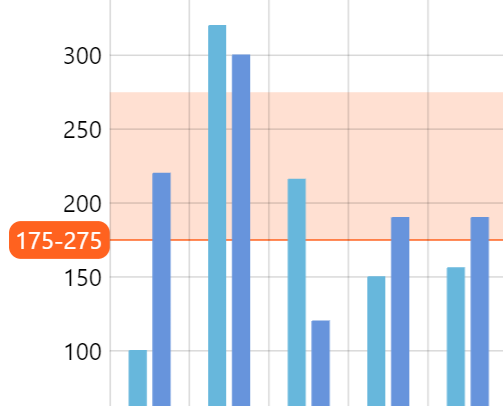
0 (zero) means label will be placed on the start value, 1 (one) - end value, while intermediate value will place the label relative to the actual range.
location: 0 (default)
location: 0.5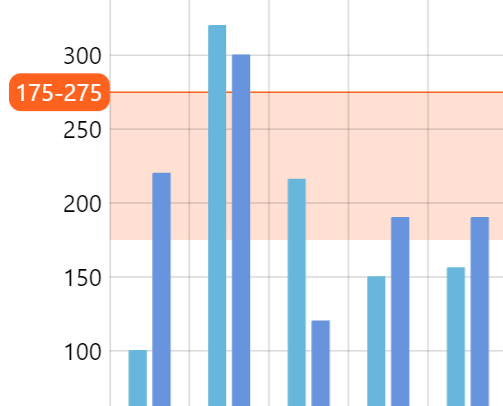
location: 1See the Pen Radar chart with custom angles by amCharts team (@amcharts) on CodePen.
NOTELabels are shown on the axis itself by default. For tips on how to move them on the opposite side of the chart, refer to "Aligning axis range labels" tutorial.
Bullet
It's also possible to show a bullet with any element in it by setting range data item's bullet property:
rangeDataItem.set("bullet", am5xy.AxisBullet.new(root, {
  sprite: am5.Picture.new(root, {
    width: 50,
    height: 50,
    centerX: am5.percent(0),
    centerY: am5.percent(100),
    src: "path/to/icon.svg"
  })
}));
rangeDataItem.set("bullet", am5xy.AxisBullet.new(root, {
  sprite: am5.Picture.new(root, {
    width: 50,
    height: 50,
    centerX: am5.percent(0),
    centerY: am5.percent(100),
    src: "path/to/icon.svg"
  })
}));
See the Pen Axis ranges by amCharts team (@amcharts) on CodePen.
Axis bullets will be placed directly on the axis. If we would like to move those somewhere else, like for instance on top of plot container, we will need to adjust their y setting using an adapter:
let bullet = am5.Picture.new(root, {
  width: 24,
  height: 24,
  centerX: am5.percent(0),
  centerY: am5.percent(100),
  src: bullet
});

bullet.adapters.add("y", function(y, target) {
  return -1 * chart.plotContainer.getPrivate("height");
});

rangeDataItem.set("bullet", am5xy.AxisBullet.new(root, {
  sprite: bullet
}));
var bullet = am5.Picture.new(root, {
  width: 24,
  height: 24,
  centerX: am5.percent(0),
  centerY: am5.percent(100),
  src: bullet
});

bullet.adapters.add("y", function(y, target) {
  return -1 * chart.plotContainer.getPrivate("height");
});

rangeDataItem.set("bullet", am5xy.AxisBullet.new(root, {
  sprite: bullet
}));
See the Pen Axis icons via ranges by amCharts team (@amcharts) on CodePen.
For more information about bullets, refer to "Bullets" tutorial.
Grid/fill above series
Normally, axis range's grid and fill will be drawn behind series.
If we'd like to move it in front of series, we can do so by setting above to true in a related data item:
// Create range axis data item
let rangeDataItem = yAxis.makeDataItem({
  value: 100,
  above: true
});

// Create a range
let range = yAxis.createAxisRange(rangeDataItem);
// Create range axis data item
var rangeDataItem = yAxis.makeDataItem({
  value: 100,
  above: true
});

// Create a range
var range = yAxis.createAxisRange(rangeDataItem);
NOTE The setting above is not dynamic. It needs to be set before actual axis range is created. Subsequent changes to this setting will have no effect.
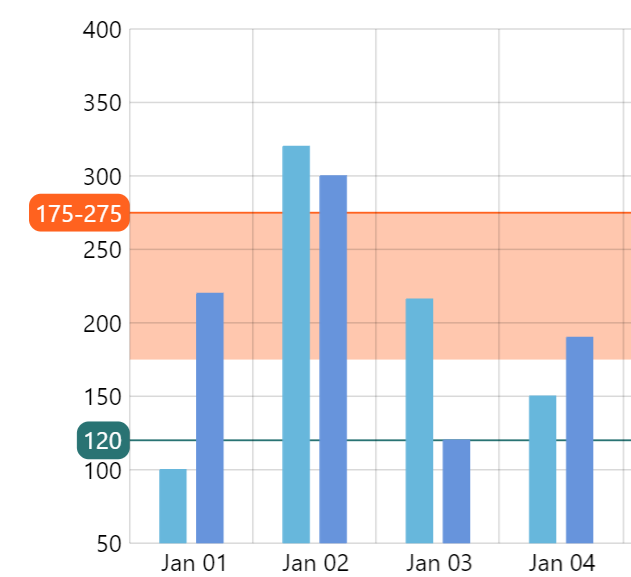
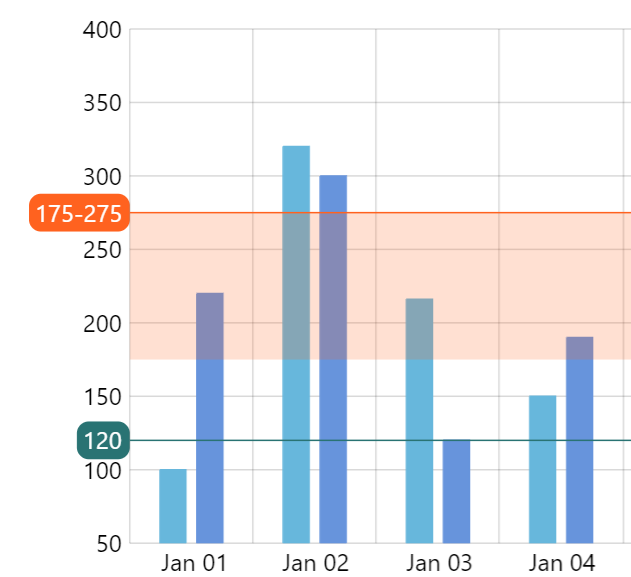
above: trueIncluding in min/max
Normally, axis ranges are not included in the calculation of the scope of values of the value axis.
If we'd like particular axis range to influence that scale, we can set affectsMinMax: true in its data item:
// Create range axis data item
let rangeDataItem = yAxis.makeDataItem({
  value: 100,
  affectsMinMax: true
});

// Create a range
let range = yAxis.createAxisRange(rangeDataItem);
// Create range axis data item
var rangeDataItem = yAxis.makeDataItem({
  value: 100,
  affectsMinMax: true
});

// Create a range
var range = yAxis.createAxisRange(rangeDataItem);
Series axis ranges
Axis ranges can also be used to modify appearance of segments of series that fall within specific specific value/date/category range.
Creating a series axis range is similar to one of create a regular range with two exceptions:
createAxisRange()method should be called on a series, instead of the axis itself.- Series-specific settings need to be set on a range.
Creating series axis range
// Create range axis data item
let rangeDataItem = yAxis.makeDataItem({
  value: 100,
  endvalue: 200
});

// Create a range on series
let range = series.createAxisRange(rangeDataItem);
// Create range axis data item
var rangeDataItem = yAxis.makeDataItem({
  value: 100,
  endvalue: 200
});

// Create a range on series
var range = series.createAxisRange(rangeDataItem);
NOTEcreateAxisRange() creates the necessary range elements such as grid, labels, and fill, and returns the same data item passed in to it.
Setting series appearance
Configuring appearance of a series segment within a range is done very similarly to configuring the series itself: via templates of specific elements.
For example we would configure column series columns, via its columns.template. Or line series via its strokes.template and fills.template.
Configuring series look within a range is identical to that, except we use element templates on an axis range object returned by series createAxisRange() method.
Here's an example for ColumnSeries:
range.columns.template.setAll({
  fill: am5.color(0xff621f),
  stroke: am5.color(0xff621f)
});
range.columns.template.setAll({
  fill: am5.color(0xff621f),
  stroke: am5.color(0xff621f)
});
See the Pen Axis ranges by amCharts team (@amcharts) on CodePen.
And here's for LineSeries:
range.fills.template.setAll({
  fill: am5.color(0xff621f),
  stroke: am5.color(0xff621f)
});
range.fills.template.setAll({
  fill: am5.color(0xff621f),
  stroke: am5.color(0xff621f)
});
See the Pen Axis ranges with series by amCharts team (@amcharts) on CodePen.
And here's another demo that uses date axis for is range:
See the Pen Axis ranges with line series by amCharts team (@amcharts) on CodePen.
Elements on a series range
Note that axis range elements (grid, fill, label, tick) is disabled by default on a series range. If you need to enable them, set visible: true on them:
rangeDataItem.get("grid").setAll({
  visible: true
});

rangeDataItem.get("axisFill").setAll({
  fill: color,
  fillOpacity: 0.2,
  visible: true
});
rangeDataItem.get("grid").setAll({
  visible: true
});

rangeDataItem.get("axisFill").setAll({
  fill: color,
  fillOpacity: 0.2,
  visible: true
});
Removing
To remove an existing axis range, all we need to do is simply remove it from axisRanges list.
For simple axis ranges, we would do that on axis' axisRanges:
axis.axisRanges.removeValue(range);
axis.axisRanges.removeValue(range);
For a range attached to series, we'd rather use series' axisRanges:
series.axisRanges.removeValue(range);
series.axisRanges.removeValue(range);