Radar chart is used to create circular axis-based two-dimensional plots as well as gauges.
Radar vs XY
We can think of a radar chart as a round XY chart. Under the hood, it is in fact an XY chart, inheriting all of its capabilities and functionality, except for a few differences and additions, which we will discuss during this tutorial.
To keep it simple, we are going to provide bare basics here, and will not repeat vas information outlined in XY-related tutorials.
In a nutshell, radar chart acts and is configured much like XY chart, except it uses different classes:
| Radar class | Equivalent XY class |
|---|---|
RadarChart | XYChart |
RadarColumnSeries | ColumnSeries |
RadarLineSeries | LineSeries |
SmoothedRadarLineSeries | SmoothedXLineSeries |
RadarCursor | XYCursor |
AxisRendererCircular | AxisRendererX |
AxisRendererRadial | AxisRendererY |
Now that we have this out of the way, let's look at common components that radar chart is made of.
Loading required modules
XY Charts require three amCharts 5 modules: "index", "xy", and "radar".
You can import those in your TypeScript / ES6 application as JavaScript modules:
import * as am5 from "@amcharts/amcharts5";
import * as am5xy from "@amcharts/amcharts5/xy";
import * as am5radar from "@amcharts/amcharts5/radar";
For vanilla JavaScript applications and web pages, you can use "script" version:
<script src="https://cdn.amcharts.com/lib/5/index.js"></script>
<script src="https://cdn.amcharts.com/lib/5/xy.js"></script>
<script src="https://cdn.amcharts.com/lib/5/radar.js"></script>
MORE INFO For more information on installing amCharts 5 as well as loading modules refer to our "Getting started" tutorial.
Instantiating the chart
As with any chart type in amCharts 5, we'll need to start with creation of the Root element.
In it we will create an instance of RadarChart class.
let root = am5.Root.new("chartdiv");
let chart = root.container.children.push(
  am5radar.RadarChart.new(root, {})
);
var root = am5.Root.new("chartdiv");
var chart = root.container.children.push(
  am5radar.RadarChart.new(root, {})
);
MORE INFO The notion of creating class instances using .new() method is described in "Creating a chart" section in the "Getting started" tutorial. Make sure you check it out.
Adding axes
A radar requires at least one circular (round axis that form a (semi)circle around the chart) and one radial (axis that start in the middle of the chart and go outwards in a straight line) axis, although it can support any number of axes.
The chart has two properties: xAxes and yAxes.
xAxes hold circular axes. yAxes hold radial axes.
To add axes to chart we just push their instances to the respective list:
let xAxis = chart.xAxes.push(
  am5xy.DateAxis.new(root, {
    renderer: am5radar.AxisRendererCircular.new(root, {})
  })
);

let yAxis = chart.yAxes.push(
  am5xy.ValueAxis.new(root, {
    renderer: am5radar.AxisRendererRadial.new(root, {})
  })
);
var xAxis = chart.xAxes.push(
  am5xy.DateAxis.new(root, {
    renderer: am5radar.AxisRendererCircular.new(root, {})
  })
);

var yAxis = chart.yAxes.push(
  am5xy.ValueAxis.new(root, {
    renderer: am5radar.AxisRendererRadial.new(root, {})
  })
);
The above will create an radial axis of type ValueAxis, which is used to indicate numeric value, as well as a DateAxis to be used as circular axis.
There are number of different axes types. We will examine those in subsequent sections.
Axis renderer
The axis object itself provides logic functionality. It relies on a helper class to actually render it. That's where "renderer" comes in.
To put it differently, axis knows how to treat data, calculate scale, etc. It does not care about how it should be displayed.
Renderer, knows how to put the axis on screen.
For example, a ValueAxis on X would be drawn differently than on Y. That's why we need to specify a renderer, which "specializes" of displaying an axis in specific direction.
Radar chart uses two types of renderers: AxisRendererCircular and AxisRendererRadial.
Axis types
Radar chart supports 4 axis types:
| Class | Comment | |
|---|---|---|
CategoryAxis | For plotting data with string identifiers - categories. | More info |
CategoryDateAxis | For plotting time-based data without maintaining actual time scale. Grid/labels are displayed only where there is actual data. | More info |
DateAxis | For plotting time-based data. The axis will maintain natural time scale regardless on how actual data points are spaced out. | More info |
ValueAxis | For plotting numeric values. | More info |
Some axis types require additional configuration besides renderer to work.
For example CategoryAxis needs categoryField which specifies a field in data that holds category names, as well as the actual data, so that it knows which categories to display:
let xAxis = chart.xAxes.push(
  am5xy.CategoryAxis.new(root, {
    renderer: am5radar.AxisRendererCircular.new(root, {}),
    categoryField: "category"
  })
);
xAxis.data.setAll([{
  category: "Research"
}, {
  category: "Marketing"
}, {
  category: "Sales"
}];
var xAxis = chart.xAxes.push(
  am5xy.CategoryAxis.new(root, {
    renderer: am5radar.AxisRendererCircular.new(root, {}),
    categoryField: "category"
  })
);
xAxis.data.setAll([{
  category: "Research"
}, {
  category: "Marketing"
}, {
  category: "Sales"
}];
Similarly, DateAxis needs to know granularity of your data, set via baseInterval property:
let xAxis = chart.xAxes.push(
  am5xy.DateAxis.new(root, {
    renderer: am5radar.AxisRendererCircular.new(root, {}),
    baseInterval: {
      timeUnit: "day",
      count: 1
    }
  })
);
var xAxis = chart.xAxes.push(
  am5xy.DateAxis.new(root, {
    renderer: am5radar.AxisRendererCircular.new(root, {}),
    baseInterval: {
      timeUnit: "day",
      count: 1
    }
  })
);
MORE INFO For information on configuring and using each axis type, please refer to the dedicated "Axes" tutorial, or click on an axis class name in the table above.
Configuring series
For more information on how to configure axes, please visit these tutorials:
Adding series
Radar chart is a "serial" chart, meaning it needs at least one series to display anything.
As with anything else in amCharts 5, we create a series object using new() method of its class.
There is also a number of properties that need to be set for series, like its X and Y axis, as well as data fields.
We will look at those shortly, but here's a very basic example of RadarColumnSeries usage:
let series = chart.series.push(
  am5radar.RadarColumnSeries.new(root, {
    name: "Series",
    xAxis: xAxis,
    yAxis: yAxis,
    valueYField: "value",
    valueXField: "date"
  })
);
var series = chart.series.push(
  am5radar.RadarColumnSeries.new(root, {
    name: "Series",
    xAxis: xAxis,
    yAxis: yAxis,
    valueYField: "value",
    valueXField: "date"
  })
);
Let's examine the above.
Assigning series to axis
This is pretty much self-explanatory. We use series xAxis property to tell which axis object will be series X-axis (or circular axis), and yAxis to specify which axis is responsible for its Y (radial) plot.
Each series can have only on X and one Y axis, whereas an axis can have any number of series attached to it.
Data fields
Since radar chart is a two-dimensional chart, each point in its series requires at least two values to be plotted: X and Y.
Data fields are used to specify which fields in data hold both of those values.
The name of the data field reflects its axis direction, as well as its type.
"value" indicates numeric value, including time.
"category" indicates string-based category.
The type of data field depends on the type of axis we are using.
For example, if we have a ValueAxis as a Y-axis, and a CategoryAxis as an X-axis, our series will need to define valueYField and categoryXField.
Some series can define additional data fields (e.g. for open values) to draw floating columns, or semi-filled area series.
MORE INFO For more information about data fields refer to "Data fields" section in our "Series" tutorial.
Types of series
Radar chart currently supports these types of series:
| Class | Comment | |
|---|---|---|
RadarColumnSeries | Displays columns or bars. | More info |
RadarLineSeries | Displays lines or area. | More info |
SmoothedRadarLineSeries | Displays smoothed lines or area with configurable horizontal tension. | More info |
NOTE The links in the above table point to tutorial for XY chart equivalent series. Don't be alarmed, it's not a mistake. Radar and XY series are configured identically.
Configuring series
For more information on how to configure series, please visit these tutorials:
Setting data
Data in radar chart is set directly to series. There is no chart-wide data storage.
For that, each series has a property named data, which in turn is an object that can be used to supply data.
The most common method for setting data is its setAll() method:
series.data.setAll([{
  category: "Research",
  value: 1000
}, {
  category: "Marketing",
  value: 1200
}, {
  category: "Sales",
  value: 850
}]);
series.data.setAll([{
  category: "Research",
  value: 1000
}, {
  category: "Marketing",
  value: 1200
}, {
  category: "Sales",
  value: 850
}]);
If we have more than one series, we will need to set data for each and everyone one of them, even if the data is identical.
That's why it makes sense to have repeating data in a separate variable. E.g.:
let data = [{
  category: "Research",
  value1: 1000,
  value2: 588
}, {
  category: "Marketing",
  value1: 1200,
  value2: 1800
}, {
  category: "Sales",
  value1: 850,
  value2: 1230
}];
series1.data.setAll(data);
series2.data.setAll(data);
var data = [{
  category: "Research",
  value1: 1000,
  value2: 588
}, {
  category: "Marketing",
  value1: 1200,
  value2: 1800
}, {
  category: "Sales",
  value1: 850,
  value2: 1230
}];
series1.data.setAll(data);
series2.data.setAll(data);
IMPORTANT It's a good practice to make sure that setting data happens as late into code as possible. Once you set data, all related objects are created, so any configuration settings applied afterwards might not carry over.
MORE INFO There's more ways to set, update, add, or load data. For more information please refer to our dedicated "Data" tutorial.
Date-based data
A quick note about date-based charts (with a DateAxis): they expect data to be passed in as integer numbers - JavaScript timestamps (milliseconds elapsed since the UNIX epoch).
If you we have dates in any other format (as strings or Date objects), we'll need to set up a data processor to convert our dates to timestamps.
MORE INFO For description how it works, please refer to "Date-based data" section in our "Data" tutorial.
Additional controls
Legend
To add a legend, we simply need to create an instance of a Legend class (which is a part of "index" package), push it to chart's children (or any other place we want it to be), as well as set its data (in case of XY chart, we will probably want to use series as legend items).
let legend = chart.children.push(am5.Legend.new(root, {}));
legend.data.setAll(chart.series.values);
var legend = chart.children.push(am5.Legend.new(root, {}));
legend.data.setAll(chart.series.values);
MORE INFO For more information on how to configure the legend, set its contents, and other tricks, please visit our dedicated "Legend" tutorial.
Cursor
Adding chart cursor, which is a very useful tool, providing crosshairs and other functionality, like series and axis tooltips is pretty straightforward: we just need to create an instance of RadarCursor (from "radar" module) and set it to chart's cursor property:
chart.set("cursor", am5radar.RadarCursor.new(root, {}));
chart.set("cursor", am5radar.RadarCursor.new(root, {}));
MORE INFO For more information on how to configure the chart cursor make sure you visit "Cursor" tutorial.
Complete example
import * as am5 from "@amcharts/amcharts5";
import * as am5xy from "@amcharts/amcharts5/xy";
import * as am5radar from "@amcharts/amcharts5/radar";

// Create root and chart
let root = am5.Root.new("chartdiv");
let chart = root.container.children.push(
  am5radar.RadarChart.new(root, {})
);

// Define data
let data = [{
  date: new Date(2021, 0, 1).getTime(),
  value: 100,
  value2: 220
}, {
  date: new Date(2021, 0, 2).getTime(),
  value: 320,
  value2: 300
}, {
  date: new Date(2021, 0, 3).getTime(),
  value: 216,
  value2: 120
}, {
  date: new Date(2021, 0, 4).getTime(),
  value: 150,
  value2: 190
}, {
  date: new Date(2021, 0, 5).getTime(),
  value: 156,
  value2: 190
}, {
  date: new Date(2021, 0, 6).getTime(),
  value: 199,
  value2: 120
}, {
  date: new Date(2021, 0, 7).getTime(),
  value: 114,
  value2: 300
}, {
  date: new Date(2021, 0, 8).getTime(),
  value: 269,
  value2: 290
}, {
  date: new Date(2021, 0, 9).getTime(),
  value: 190,
  value2: 290
}, {
  date: new Date(2021, 0, 10).getTime(),
  value: 380,
  value2: 170
}, {
  date: new Date(2021, 0, 11).getTime(),
  value: 250,
  value2: 200
}, {
  date: new Date(2021, 0, 12).getTime(),
  value: 110,
  value2: 210
}, {
  date: new Date(2021, 0, 13).getTime(),
  value: 185,
  value2: 85
}, {
  date: new Date(2021, 0, 14).getTime(),
  value: 105,
  value2: 244
}];

// Create axes
let xAxis = chart.xAxes.push(
  am5xy.DateAxis.new(root, {
    renderer: am5radar.AxisRendererCircular.new(root, {})
  })
);

let yAxis = chart.yAxes.push(
  am5xy.ValueAxis.new(root, {
    renderer: am5radar.AxisRendererRadial.new(root, {})
  })
);

// Create series
let series1 = chart.series.push(
  am5radar.RadarColumnSeries.new(root, {
    name: "Series #1",
    xAxis: xAxis,
    yAxis: yAxis,
    valueYField: "value",
    valueXField: "date"
  })
);
series1.data.setAll(data);

let series2 = chart.series.push(
  am5radar.RadarColumnSeries.new(root, {
    name: "Series #2",
    xAxis: xAxis,
    yAxis: yAxis,
    valueYField: "value2",
    valueXField: "date"
  })
);
series2.data.setAll(data);

// Add legend
let legend = chart.children.push(am5.Legend.new(root, {}));
legend.data.setAll(chart.series.values);

// Add cursor


chart.set("cursor", am5radar.RadarCursor.new(root, {}));
<script src="https://cdn.amcharts.com/lib/5/index.js"></script>
<script src="https://cdn.amcharts.com/lib/5/xy.js"></script>

<div id="chartdiv"></div>

<script>
// Create root and chart
var root = am5.Root.new("chartdiv");
var chart = root.container.children.push(
  am5radar.RadarChart.new(root, {})
);

// Define data
var data = [{
  date: new Date(2021, 0, 1).getTime(),
  value: 100,
  value2: 220
}, {
  date: new Date(2021, 0, 2).getTime(),
  value: 320,
  value2: 300
}, {
  date: new Date(2021, 0, 3).getTime(),
  value: 216,
  value2: 120
}, {
  date: new Date(2021, 0, 4).getTime(),
  value: 150,
  value2: 190
}, {
  date: new Date(2021, 0, 5).getTime(),
  value: 156,
  value2: 190
}, {
  date: new Date(2021, 0, 6).getTime(),
  value: 199,
  value2: 120
}, {
  date: new Date(2021, 0, 7).getTime(),
  value: 114,
  value2: 300
}, {
  date: new Date(2021, 0, 8).getTime(),
  value: 269,
  value2: 290
}, {
  date: new Date(2021, 0, 9).getTime(),
  value: 190,
  value2: 290
}, {
  date: new Date(2021, 0, 10).getTime(),
  value: 380,
  value2: 170
}, {
  date: new Date(2021, 0, 11).getTime(),
  value: 250,
  value2: 200
}, {
  date: new Date(2021, 0, 12).getTime(),
  value: 110,
  value2: 210
}, {
  date: new Date(2021, 0, 13).getTime(),
  value: 185,
  value2: 85
}, {
  date: new Date(2021, 0, 14).getTime(),
  value: 105,
  value2: 244
}];

// Create axes
var xAxis = chart.xAxes.push(
  am5xy.DateAxis.new(root, {
    renderer: am5radar.AxisRendererCircular.new(root, {})
  })
);

var yAxis = chart.yAxes.push(
  am5xy.ValueAxis.new(root, {
    renderer: am5radar.AxisRendererRadial.new(root, {})
  })
);

// Create series
var series1 = chart.series.push(
  am5radar.RadarColumnSeries.new(root, {
    name: "Series #1",
    xAxis: xAxis,
    yAxis: yAxis,
    valueYField: "value",
    valueXField: "date"
  })
);
series1.data.setAll(data);

var series2 = chart.series.push(
  am5radar.RadarColumnSeries.new(root, {
    name: "Series #2",
    xAxis: xAxis,
    yAxis: yAxis,
    valueYField: "value2",
    valueXField: "date"
  })
);
series2.data.setAll(data);

// Add legend
var legend = chart.children.push(am5.Legend.new(root, {}));
legend.data.setAll(chart.series.values);

// Add cursor
chart.set("cursor", am5radar.RadarCursor.new(root, {}));
</script>
See the Pen Radar chart with date axis by amCharts team (@amcharts) on CodePen.
Start/end angles
A radar chart is not limited to a full circle. It can start and end at any angle.
For that we have to chart's settings: startAngle and endAngle.
These are numeric values denoting degrees.
A zero angle is one that goes from the center of the chart directly to right.
Defaults are -90 (startAngle) and 270 (endAngle) forming full circle starting at vertical line up.
We can change that any way we want.
let chart = root.container.children.push(
  am5radar.RadarChart.new(root, {
    startAngle: -180,
    endAngle: 0
  })
);
var chart = root.container.children.push(
  am5radar.RadarChart.new(root, {
    startAngle: -180,
    endAngle: 0
  })
);
The above will result in a horizontal semi-circle:
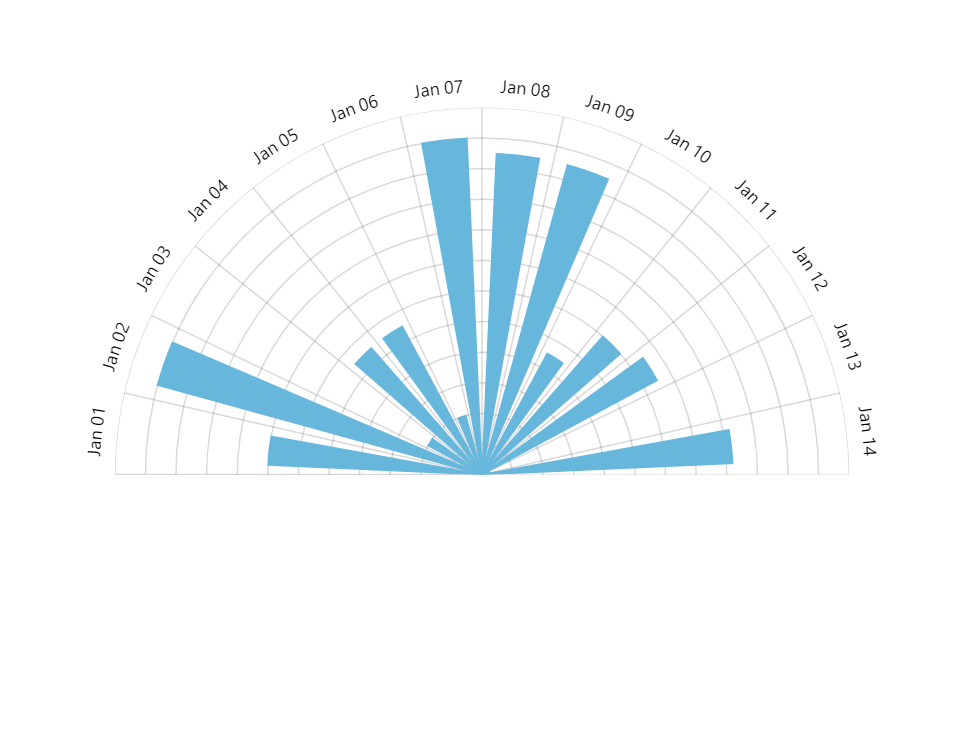
{ startAngle: -180, endAngle: 0 }See the Pen Radar chart with date axis by amCharts team (@amcharts) on CodePen.
Chart radius
Outer radius
Radar chart's outer radius can be set using its radius setting.
It can be either percent value (relative to available space) or fixed pixel value.
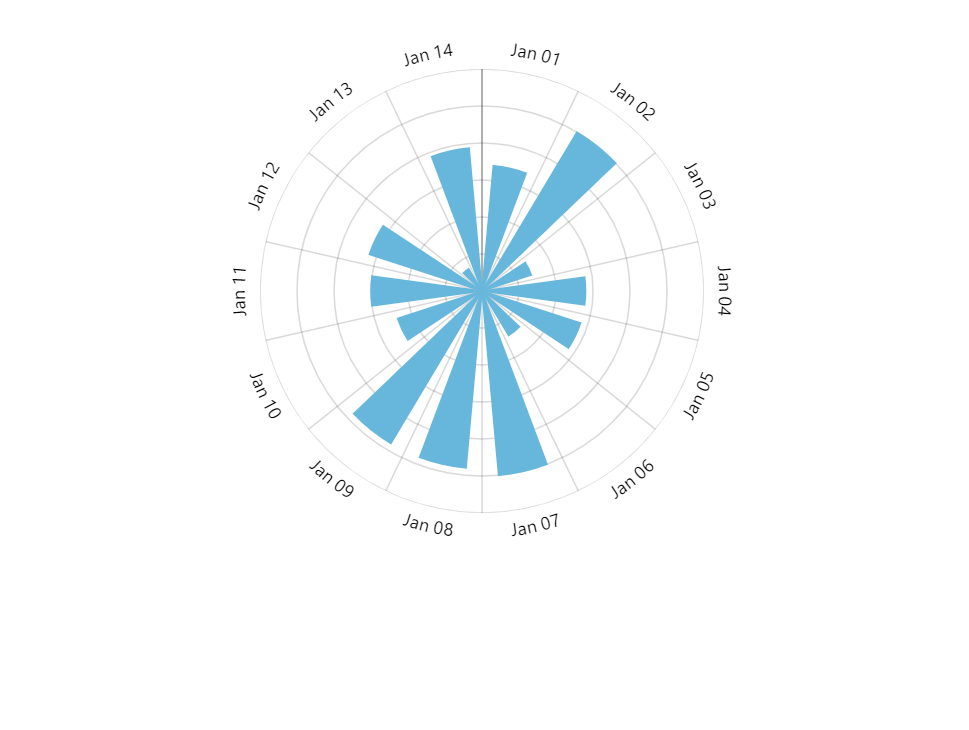
Radar chart's radius is set to 80% by default to leave some space for possible ticks and labels.
If we do not need that extra space, we can increase the radius:
let chart = root.container.children.push(
  am5radar.RadarChart.new(root, {
    radius: am5.percent(95)
  })
);
var chart = root.container.children.push(
  am5radar.RadarChart.new(root, {
    radius: am5.percent(95)
  })
);
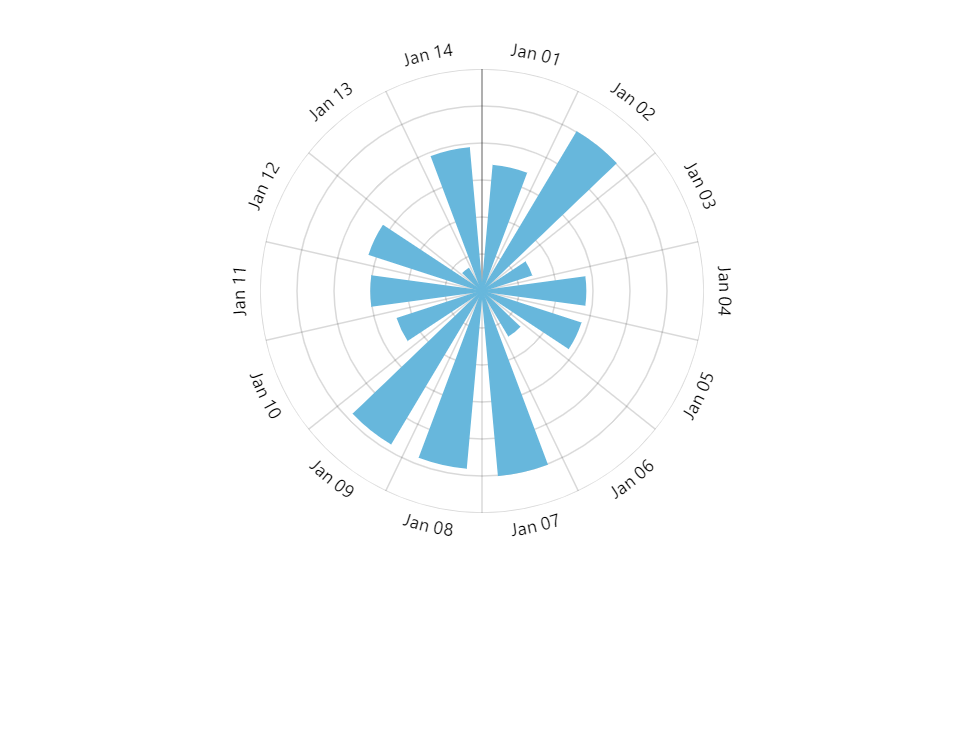
radius: am5.percent(80) (default)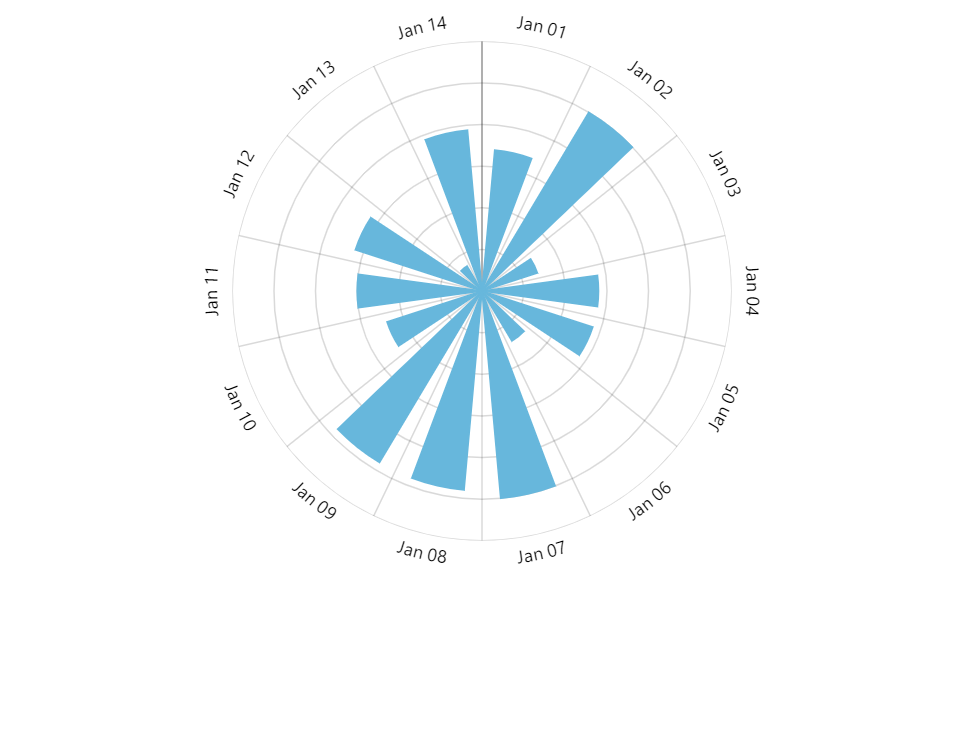
radius: am5.percent(90)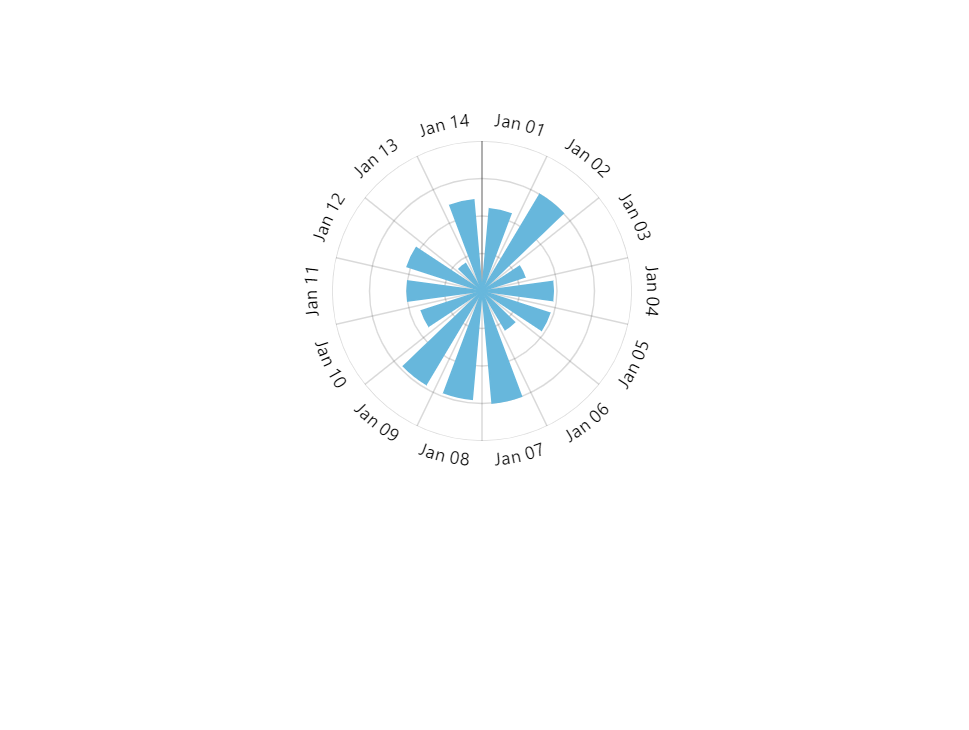
radius: 100Inner radius
Chart's innerRadius settings controls the "hole" inside the radar.
As with radius it can be either a percent value or fixed pixel value.
The difference is that innerRadius percent value is relative to the chart radius, rather than available space.
We can also use negative values in innerRadius. Those will mean pixel distance from the outer radius. This allows creating fixed-width bands.
let chart = root.container.children.push(
  am5radar.RadarChart.new(root, {
    radius: am5.percent(95),
    innerRadius: am5.percent(50)
  })
);
var chart = root.container.children.push(
  am5radar.RadarChart.new(root, {
    radius: am5.percent(95),
    innerRadius: am5.percent(50)
  })
);

innerRadius: 0 (default)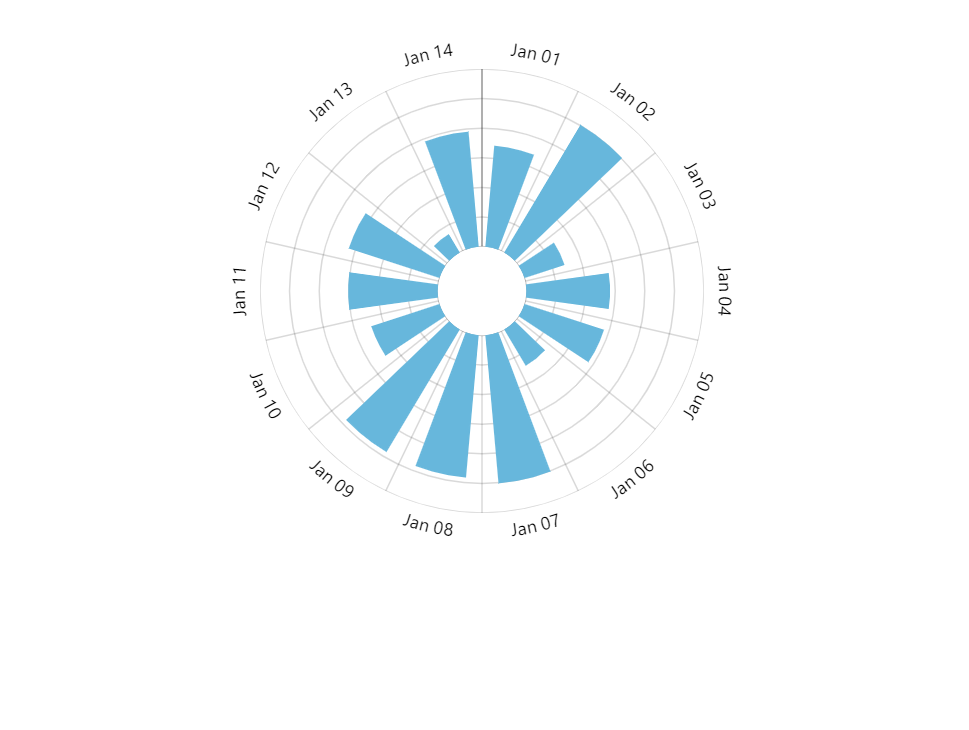
innerRadius: am5.percent(20)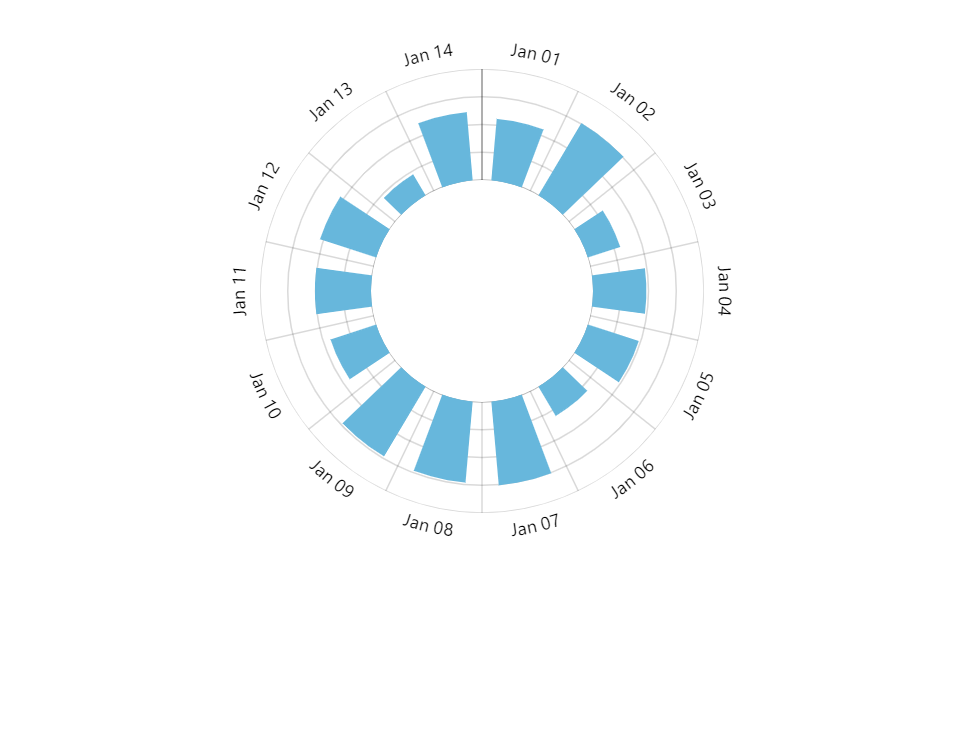
innerRadius: am5.percent(50) Gauge charts
amCharts 5 does not have a separate gauge chart type.
Please refer to "Gauge charts" tutorial on how to use radar chart to create full-featured gauges.