This tutorial will walk through most common aspects of creating pie and donut charts.
Loading required modules
Everything required to create pie charts are two amCharts 5 modules: "index" and "percent".
You can import those in your TypeScript / ES6 application as JavaScript modules:
import * as am5 from "@amcharts/amcharts5";
import * as am5percent from "@amcharts/amcharts5/percent";
For vanilla JavaScript applications and web pages, you can use "script" version:
<script src="https://cdn.amcharts.com/lib/5/index.js"></script>
<script src="https://cdn.amcharts.com/lib/5/percent.js"></script>
MORE INFO For more information on installing amCharts 5 as well as loading modules refer to our "Getting started" tutorial.
Instantiating the chart
As with any chart type in amCharts 5, we'll need to start with creation of the Root element.
In it we will create an instance of PieChart class to create a pie chart
let root = am5.Root.new("chartdiv");
let chart = root.container.children.push(
  am5percent.PieChart.new(root, {})
);
var root = am5.Root.new("chartdiv");
var chart = root.container.children.push(
  am5percent.PieChart.new(root, {})
);
MORE INFO The notion of creating class instances using .new() method is described in "Creating a chart" section in the "Getting started" tutorial. Make sure you check it out.
Series
Adding
Pie chart supports one series type: PieSeries.
Like everywhere else, we use its new() method to instantiate series, then push it into series list of the chart:
let series = chart.series.push(
  am5percent.PieSeries.new(root, {
    name: "Series",
    categoryField: "country",
    valueField: "sales"
  })
);
var series = chart.series.push(
  am5percent.PieSeries.new(root, {
    name: "Series",
    categoryField: "country",
    valueField: "sales"
  })
);
Data fields
Pie chart series require two to dimensions of data: a string-based category and a numeric value.
Data fields basically mean which keys in data objects to look for specific value.
They can be set via series' settings categoryField and valueField.
Let's take sample data:
[{
  country: "France",
  sales: 100000
}, {
  country: "Spain",
  sales: 160000
}, {
  country: "United Kingdom",
  sales: 80000
}]
The following data fields would need to describe data fields like this:
let series = chart.series.push(
  am5percent.PieSeries.new(root, {
    name: "Series",
    categoryField: "country",
    valueField: "sales"
  })
);
var series = chart.series.push(
  am5percent.PieSeries.new(root, {
    name: "Series",
    categoryField: "country",
    valueField: "sales"
  })
);
Setting data
The data is set directly on series via its data property:
series.data.setAll([{
  country: "France",
  sales: 100000
}, {
  country: "Spain",
  sales: 160000
}, {
  country: "United Kingdom",
  sales: 80000
}]);
series.data.setAll([{
  country: "France",
  sales: 100000
}, {
  country: "Spain",
  sales: 160000
}, {
  country: "United Kingdom",
  sales: 80000
}]);
IMPORTANT It's a good practice to make sure that setting data happens as late into code as possible. Once you set data, all related objects are created, so any configuration settings applied afterwards might not carry over.
MORE INFO There are more ways to set, update, add, or load data. For more information please refer to our dedicated "Data" tutorial.
Series appearance
For more information about configuring appearance of the pie series, refer to "Pie series".
Legend
To add a legend, we simply need to create an instance of a Legend class (which is a part of "core" package), push it to chart's children (or any other place we want it to be), as well as set its data (in case of percent chart, we will probably want to have each slice as a legend item).
let legend = chart.children.push(am5.Legend.new(root, {
  centerX: am5.percent(50),
  x: am5.percent(50),
  layout: root.horizontalLayout
}));

legend.data.setAll(series.dataItems);
var legend = chart.children.push(am5.Legend.new(root, {
  centerX: am5.percent(50),
  x: am5.percent(50),
  layout: root.horizontalLayout
}));

legend.data.setAll(series.dataItems);
MORE INFO For more information on how to configure the legend, set its contents, and other tricks, please visit our dedicated "Legend" tutorial.
Complete example
import * as am5 from "@amcharts/amcharts5";
import * as am5percent from "@amcharts/amcharts5/percent";

// Create root and chart
let root = am5.Root.new("chartdiv");
let chart = root.container.children.push(
  am5percent.PieChart.new(root, {
    layout: root.verticalHorizontal
  })
);

// Define data
let data = [{
  country: "France",
  sales: 100000
}, {
  country: "Spain",
  sales: 160000
}, {
  country: "United Kingdom",
  sales: 80000
}];

// Create series
let series = chart.series.push(
  am5percent.PieSeries.new(root, {
    name: "Series",
    valueField: "sales",
    categoryField: "country"
  })
);
series.data.setAll(data);

// Add legend
let legend = chart.children.push(am5.Legend.new(root, {
  centerX: am5.percent(50),
  x: am5.percent(50),
  layout: root.horizontalLayout
}));

legend.data.setAll(series.dataItems);
<script src="https://cdn.amcharts.com/lib/5/index.js"></script>
<script src="https://cdn.amcharts.com/lib/5/percent.js"></script>

<div id="chartdiv"></div>

<script>
// Create root and chart
var root = am5.Root.new("chartdiv");
var chart = root.container.children.push(
  am5percent.PieChart.new(root, {
    layout: root.verticalHorizontal
  })
);

// Define data
var data = [{
  country: "France",
  sales: 100000
}, {
  country: "Spain",
  sales: 160000
}, {
  country: "United Kingdom",
  sales: 80000
}];

// Create series
var series = chart.series.push(
  am5percent.PieSeries.new(root, {
    name: "Series",
    valueField: "sales",
    categoryField: "country"
  })
);
series.data.setAll(data);

// Add legend
var legend = chart.children.push(am5.Legend.new(root, {
  centerX: am5.percent(50),
  x: am5.percent(50),
  layout: root.horizontalLayout
}));

legend.data.setAll(series.dataItems);
</script>
See the Pen Pie chart by amCharts team (@amcharts) on CodePen.
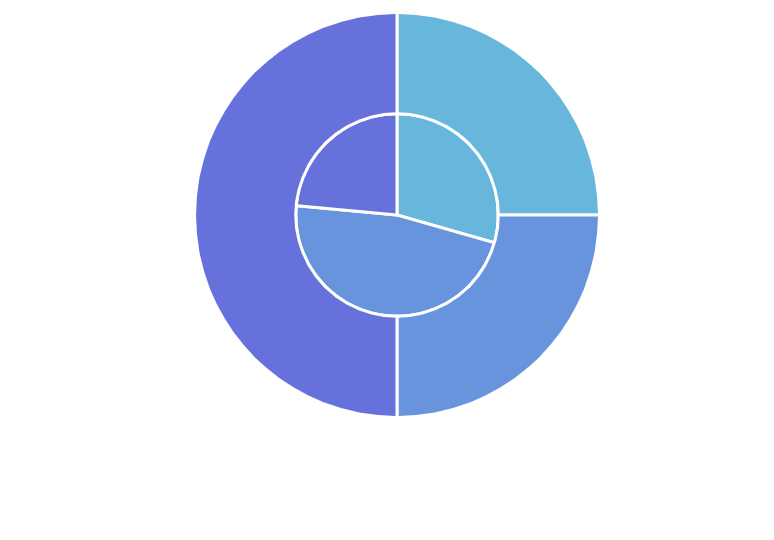
Start/end angles
A pie chart is not limited to a full circle. It can start and end at any angle.
For that we have to set chart's settings: startAngle and endAngle.
These are numeric values denoting degrees.
A zero angle is one that goes from the center of the chart directly to right.
Defaults are -90 (startAngle) and 270 (endAngle) forming full circle starting at vertical line up.
We can change that any way we want.
IMPORTANT For angles to work properly, we also need to replicate same angle settings on series, too.
let chart = root.container.children.push(
  am5percent.PieChart.new(root, {
    startAngle: -180,
    endAngle: 0
  })
);

let series = chart.series.push(
  am5percent.PieSeries.new(root, {
    name: "Series",
    valueField: "sales",
    categoryField: "country",
    startAngle: -180,
    endAngle: 0
  })
);
var chart = root.container.children.push(
  am5percent.PieChart.new(root, {
    startAngle: -180,
    endAngle: 0
  })
);

var series = chart.series.push(
  am5percent.PieSeries.new(root, {
    name: "Series",
    valueField: "sales",
    categoryField: "country",
    startAngle: -180,
    endAngle: 0
  })
);
The above will result in a horizontal semi-circle:

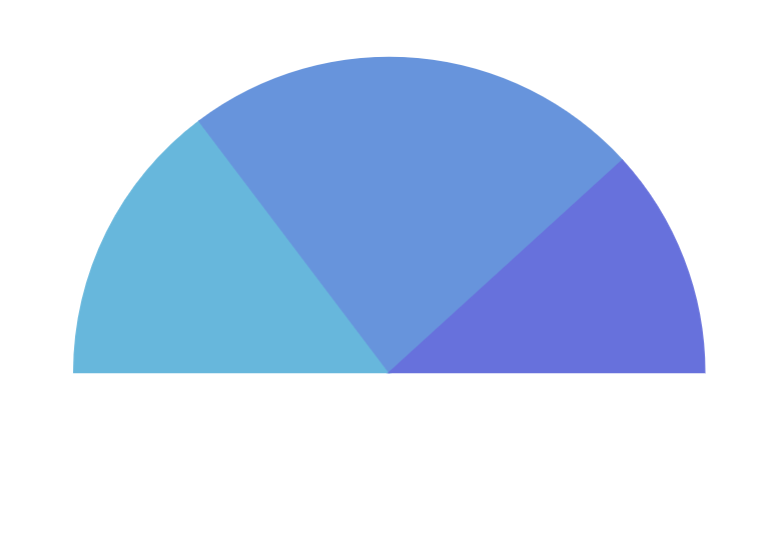
{ startAngle: -180, endAngle: 0 }See the Pen Start and end angles of a pie chart by amCharts team (@amcharts) on CodePen.
Pie radius
Outer radius
Chart's outer radius can be set using its radius setting.
It can be either percent value (relative to available space) or fixed pixel value.
Pie chart's radius is set to 80% by default to leave some space for possible ticks and labels.
If we do not need that extra space, we can increase the radius:
let chart = root.container.children.push(
  am5percent.PieChart.new(root, {
    radius: am5.percent(95)
  })
);
var chart = root.container.children.push(
  am5percent.PieChart.new(root, {
    radius: am5.percent(95)
  })
);
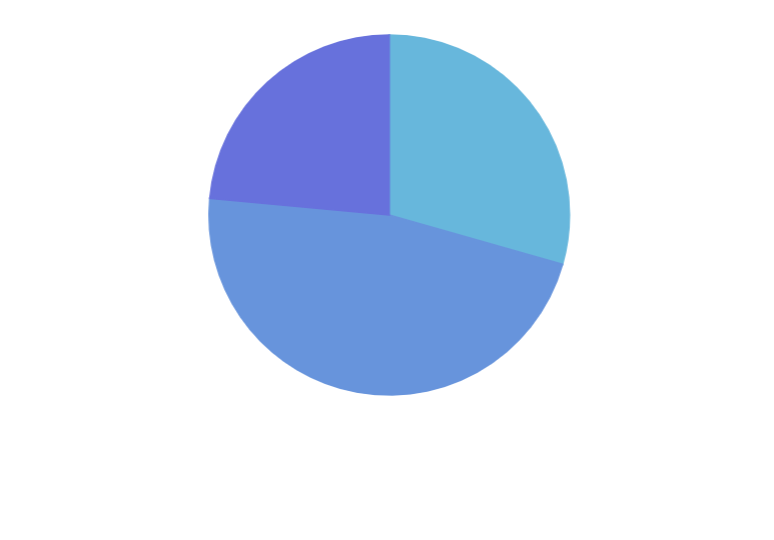
radius: am5.percent(80) (default)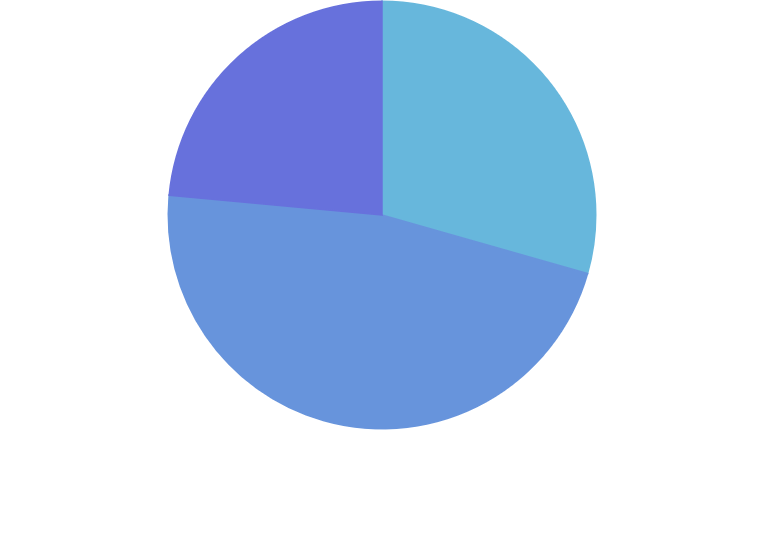
radius: am5.percent(95)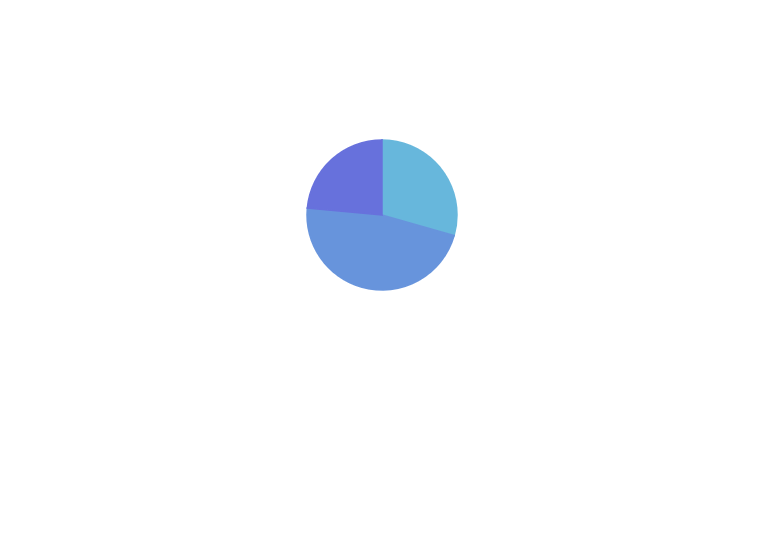
radius: 50Inner radius
Chart's innerRadius settings controls the "hole" inside the pie.
As with radius it can be either a percent value or fixed pixel value.
The difference is that innerRadius percent value is relative to the chart radius, rather than available space.
We can also use negative values in innerRadius. Those will mean pixel distance from the outer radius. This allows creating fixed-width slices.
let chart = root.container.children.push(
  am5percent.PieChart.new(root, {
    radius: am5.percent(95),
    innerRadius: am5.percent(50)
  })
);
var chart = root.container.children.push(
  am5percent.PieChart.new(root, {
    radius: am5.percent(95),
    innerRadius: am5.percent(50)
  })
);
innerRadius: 0 (default)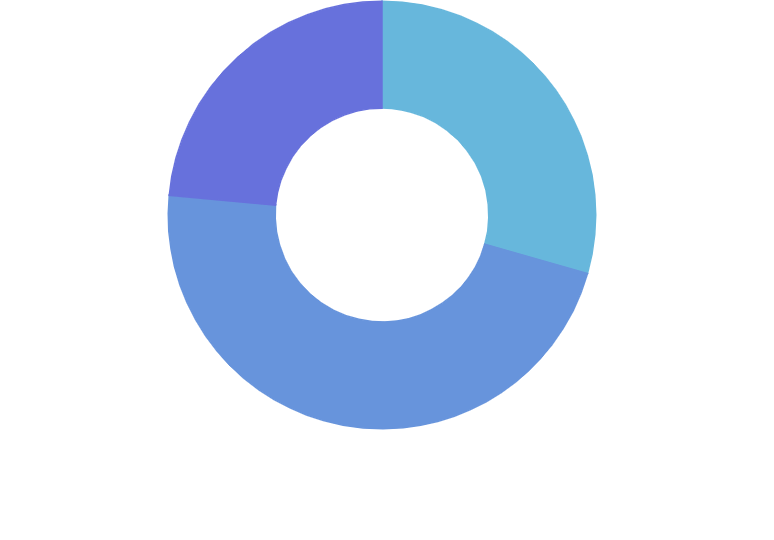
innerRadius: am5.percent(50)See the Pen Start and end angles of a pie chart by amCharts team (@amcharts) on CodePen.
Nested pie series
Pie chart supports multiple series.
If we add several series to the chart, it will automatically divvy up available the radius (as set by its radius and innerRadius settings) between all series, giving them equal space.
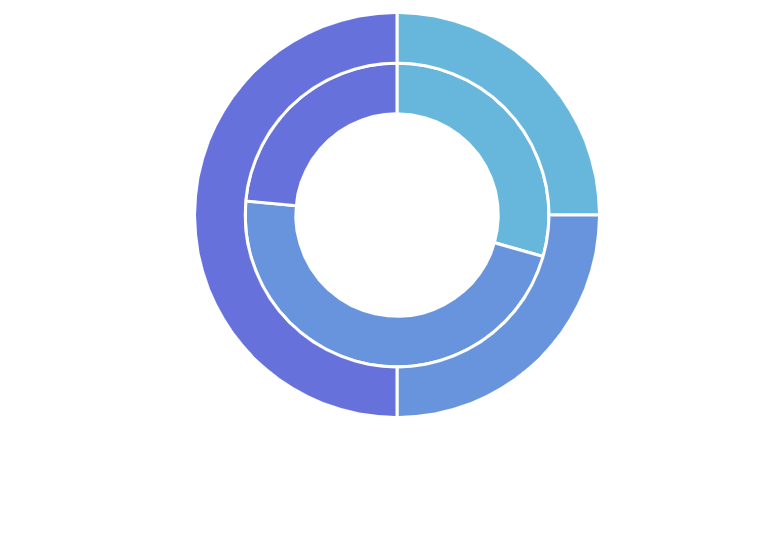
innerRadiusSee the Pen Pie chart with inner radius (donut) by amCharts team (@amcharts) on CodePen.
Animation
Normally, created series will appear on chart right away. Should we want to make it play out initial animation, we can call it's appear() method right after creating its object.
appear() method can also be called on the chart itself.
let series = chart.series.push(
  am5percent.PieSeries.new(root, {
    name: "Series",
    categoryField: "country",
    valueField: "sales"
  })
);
series.appear();
chart.appear();
var series = chart.series.push(
  am5percent.PieSeries.new(root, {
    name: "Series",
    categoryField: "country",
    valueField: "sales"
  })
);
series.appear();
chart.appear();