This tutorial is a collection of techniques that can be used to tackle various approaches to masking of bullets on an XY chart.
Default behavior
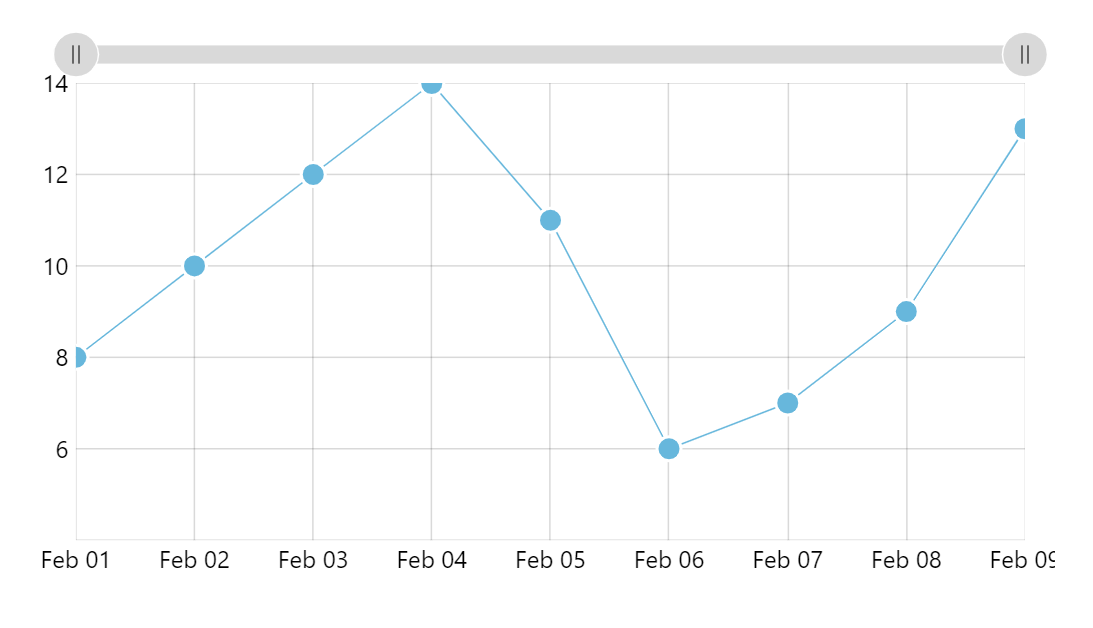
By default, an XY chart will contain all plots, including bullets within its plot area.
This means that if bullets extent beyond plot area edge, they'll be cut off.
Unmasking bullets
Disabling the bullet mask
To disable bullet masking, set maskBullets to false in your series settings:
let series = chart.series.push(am5xy.ColumnSeries.new(root, {
  xAxis: xAxis,
  yAxis: yAxis,
  valueYField: field,
  valueXField: "date",
  maskBullets: false
}));
var series = chart.series.push(am5xy.ColumnSeries.new(root, {
  xAxis: xAxis,
  yAxis: yAxis,
  valueYField: field,
  valueXField: "date",
  maskBullets: false
}));

If our chart did not have zoom capabilities, we'd be all set.
However, if the chart can be zoomed, we'll need to do some further tweaks. Read on.
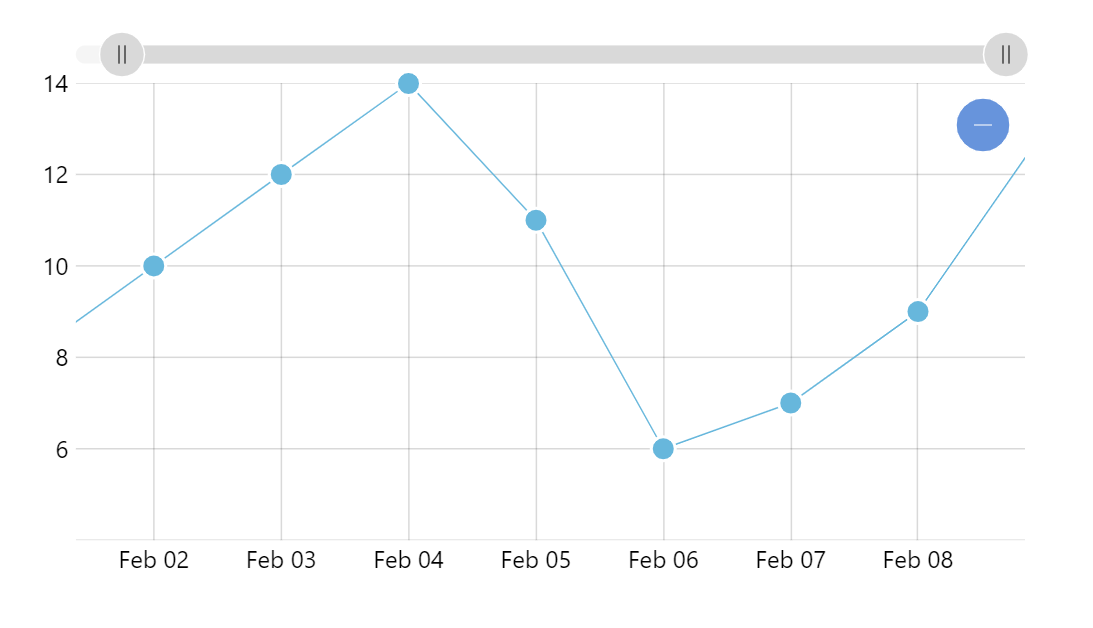
Out-of-bounds bullets
Now that we have disabled bullet masking, they're no longer constrained to plot container, which could lead to visual issues when chart is zoomed.

To work around it, we will use bullet element's events to capture the moment when its X coordinate changes, then check if it falls within plot container, and hide or show it accordingly.
series.bullets.push(function () {
  let circle = am5.Circle.new(root, {
    radius: 8,
    fill: series.get("fill"),
    stroke: am5.color(0xffffff),
    strokeWidth: 2
  });

  circle.on("x", function(x, circle) {
    if ((x < 0) || (x > chart.plotContainer.width())) {
      circle.hide(0)
    }
    else {
      circle.show(0)
    }
  });

  return am5.Bullet.new(root, {
    sprite: circle
  });
});
series.bullets.push(function () {
  var circle = am5.Circle.new(root, {
    radius: 8,
    fill: series.get("fill"),
    stroke: am5.color(0xffffff),
    strokeWidth: 2
  });

  circle.on("x", function(x, circle) {
    if ((x < 0) || (x > chart.plotContainer.width())) {
      circle.hide(0)
    }
    else {
      circle.show(0)
    }
  });

  return am5.Bullet.new(root, {
    sprite: circle
  });
});
See the Pen Hiding unmasked bullets by their X coordinate by amCharts team (@amcharts) on CodePen.
Padding plot area
Another approach for dealing for bullets that get clipped because they're too close to the edge of the plot container, is to slightly increase the scale of axis.
This can be achieve with axis' extraMin and extraMax settings, that indicate how to relatively expand its scale.
These settings will work on both value and date axes.
let yAxis = chart.yAxes.push(
  am5xy.ValueAxis.new(root, {
    extraMin: 0.05,
    extraMax: 0.05,
    renderer: am5xy.AxisRendererY.new(root, {})
  })
);
var yAxis = chart.yAxes.push(
  am5xy.ValueAxis.new(root, {
    extraMin: 0.05,
    extraMax: 0.05,
    renderer: am5xy.AxisRendererY.new(root, {})
  })
);
See the Pen Hiding unmasked bullets by their X coordinate by amCharts team (@amcharts) on CodePen.