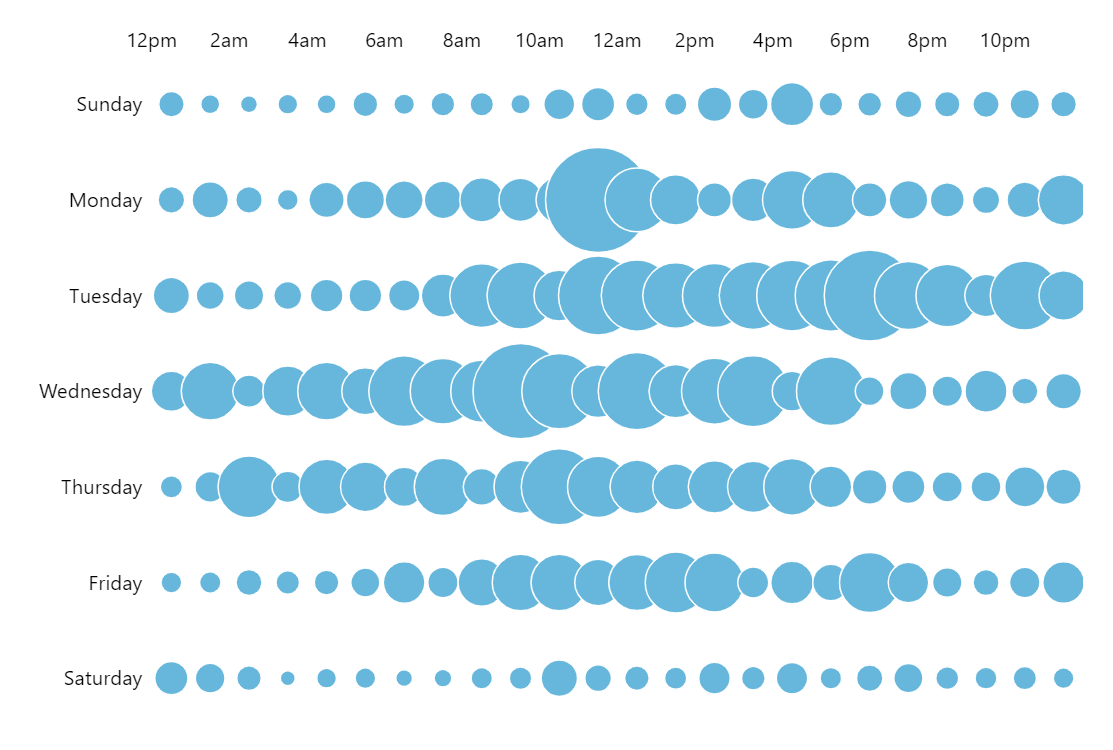
Bubble-Based Heat Map
This demo utilizes heat rules to automatically size bubble bullets based on their value.
Related tutorials
Build this chart with AI
The prompt below can be used to build this chart with AI. For best coding results, use the most advanced AI models, like Claude Opus 4.6 and GPT-5.3-Codex. For more info and tips, check out amCharts AI docs.
Create a bubble-based heat map displaying a 7x24 grid (days of the week on the Y-axis, hours of the day on the X-axis). Both axes should be hidden from view. Render circle markers whose size scales based on data values, with larger circles representing higher values. Outline each bubble with white borders. Every second, update the data values dynamically with smooth animated transitions to demonstrate real-time data changes. Use consistent fill colors across all bubbles, emphasizing size as the primary visual encoding. No tooltips, legends, or click behaviors. Use amCharts 5 library.
Demo source