Data Grouping 50K Points
This demo shows how dynamic data item grouping – a feature built-in into amCharts 5 – can help coping with large data sets.
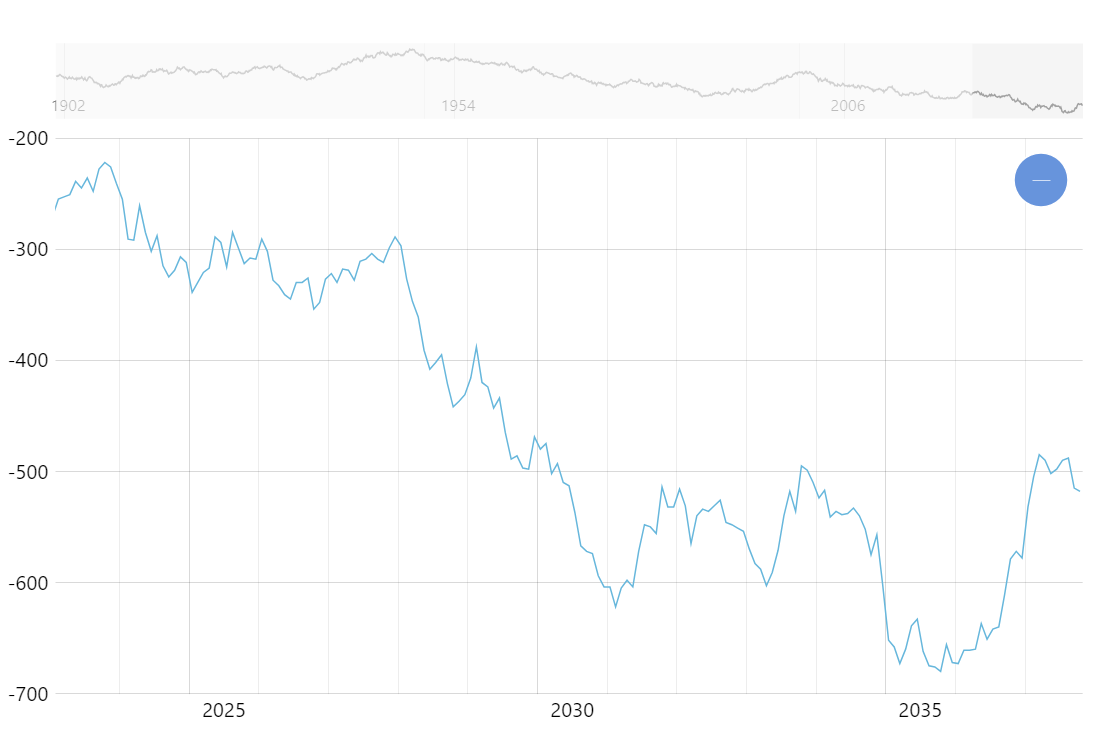
In a nutshell it ensures that no more than a fixed number of data items is displayed at any given time. The chart itself automatically adjusts data granularity, grouping data items into bigger periods.
When users zooms in, the granularity increases. This means that you can have a “bird’s eye” view of the data when zoomed out without overwhelming number of items, and access detailed values for specific periods.
And, best of all, you’re in control when specifying how aggregate values are calculated. It can be one of the absolute values like open, high, low, or close, or auto-calculated ones, like average or sum.
Read more about data item grouping
Build this chart with AI
The prompt below can be used to build this chart with AI. For best coding results, use the most advanced AI models, like Claude Opus 4.6 and GPT-5.3-Codex. For more info and tips, check out amCharts AI docs.
Create a line chart with 50,000 daily data points starting from 1900 that automatically groups data into aggregated averages when zoomed out and shows more detail on zoom-in. Include a horizontal scrollbar with a miniature chart preview, XY cursor, tooltips, minor grid lines on both axes, and entrance animation. Use amCharts 5 library.
Demo source