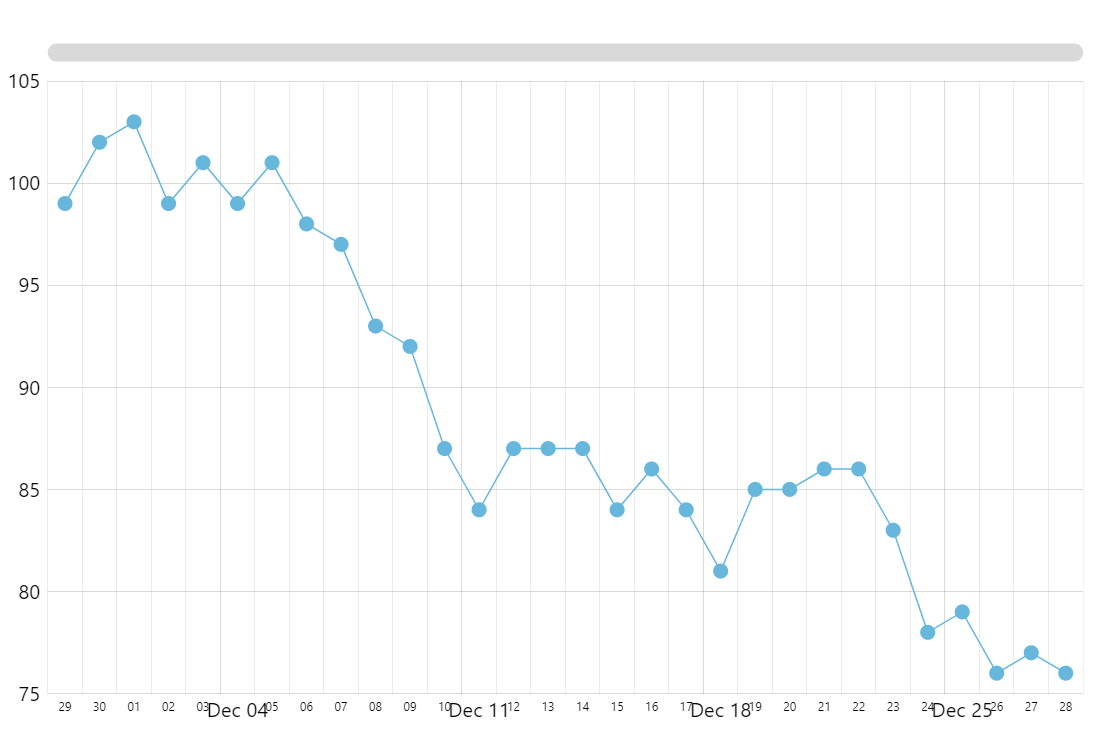
Date axis with labels near minor grid lines
Using minor grid lines enables decluttering the plot container, while still maintaining clear perception of axis scale as well as its relation to the series.
To enable labels near minor grid lines, just need to set minorLabelsEnabled: true for your axis renderer.
In this demo, we have increased minGridDistance to 200 in order for the minor labels to have enough space.
Also, we set minorDateFormats for axis as we need these labels to take as little space as possible, as we only need the day only.
The position of labels is further tweaked using custom theme.
Related documentation:
Build this chart with AI
The prompt below can be used to build this chart with AI. For best coding results, use the most advanced AI models, like Claude Opus 4.6 and GPT-5.3-Codex. For more info and tips, check out amCharts AI docs.
Create a line chart with 30 daily data points showing both major and minor grid lines. Position minor axis labels slightly below grid lines in a short date format at low opacity. Display animated circular markers at each data point. Include an XY cursor with zoom-select behavior, horizontal scrollbar, tooltips, and entrance animation. Use amCharts 5 library.
Demo source