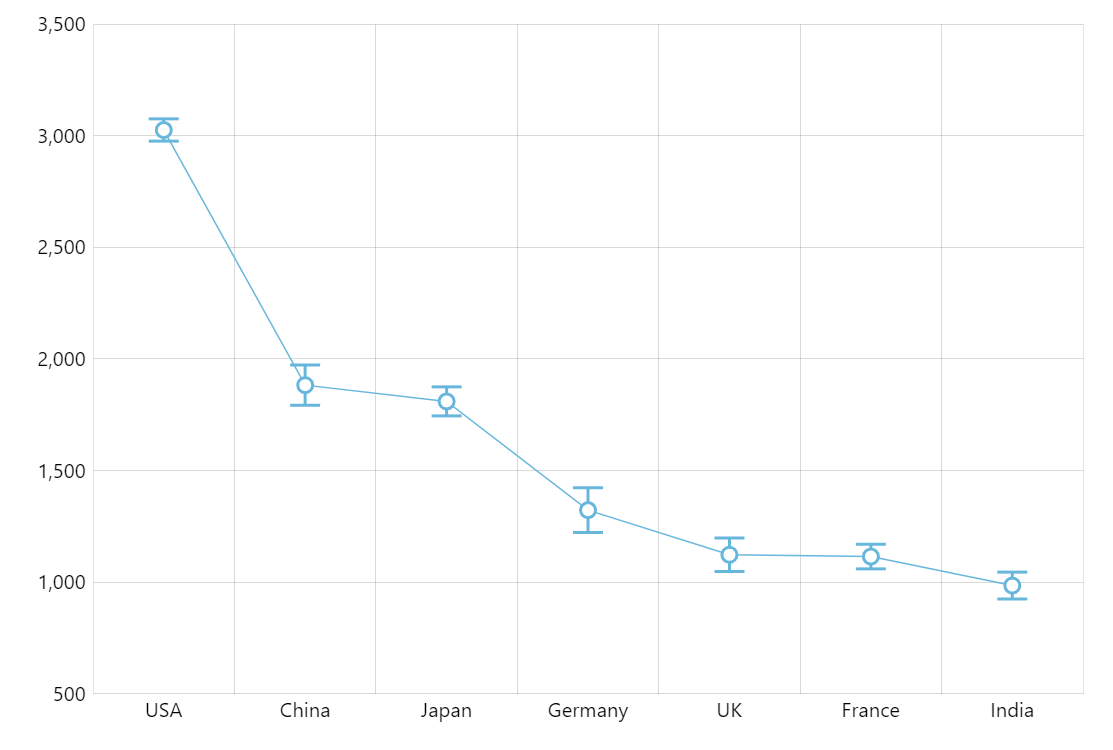
Error Chart
Error chart helps you visualize uncertainty or variability of data. This demo shows you how to create error bars on top of a regular line graph.
Key implementation details
Our main chart is just a line series and we add error bars by utilizing advanced bullet functionality in amCharts. Bullets can be all kinds of objects in amCharts and this case we create a Graphics bullet so we can draw an arbitrary shape according to our needs.
Related tutorials
Build this chart with AI
The prompt below can be used to build this chart with AI. For best coding results, use the most advanced AI models, like Claude Opus 4.6 and GPT-5.3-Codex. For more info and tips, check out amCharts AI docs.
Create a line chart with error bars for 7 countries on a category X-axis. Each data point shows a value with a vertical error bar (line with horizontal caps at top and bottom) and a circle marker. Tooltips display both value and error amount. Include pan/zoom on both axes, an XY cursor that snaps to the nearest series, and entrance animation. Use amCharts 5 library.
Demo source