Force-Directed Tree with Animated Bullets
A force-directed chart is a visual tool used to depict networks by simulating physical forces on nodes (entities) and edges (connections) between them. Nodes repel each other while edges act like springs, pulling connected nodes closer. This simulation arranges the nodes in a layout that intuitively displays clusters and connections, simplifying the understanding of complex relationships.
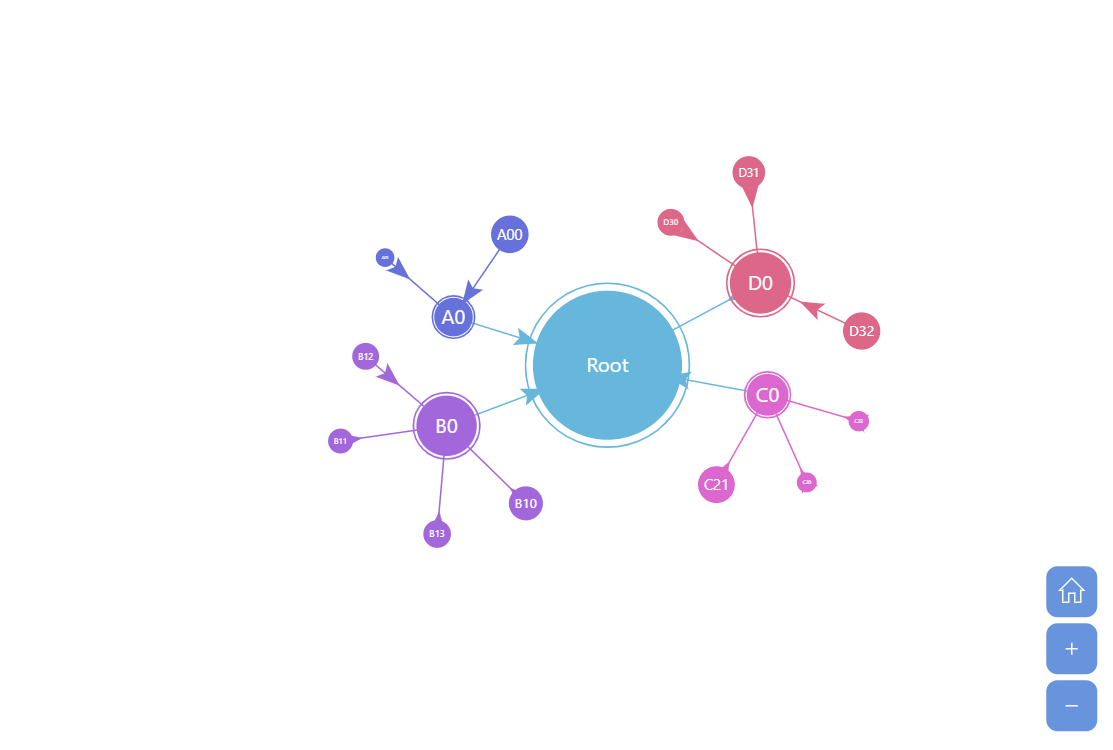
This demo features animated bullets, added to node links.
Related tutorials
Build this chart with AI
The prompt below can be used to build this chart with AI. For best coding results, use the most advanced AI models, like Claude Opus 4.6 and GPT-5.3-Codex. For more info and tips, check out amCharts AI docs.
Create a force-directed tree chart with animated arrow bullets traveling along the links between nodes. Generate random hierarchical data with a root node, multiple levels, and numeric values. Add animated arrows on each link that travel continuously from parent to child nodes, colored to match their source node, with auto-rotation to follow the link direction. The arrows should loop infinitely with a smooth animation at varying speeds for a staggered effect. Wrap in a zoomable container with mouse wheel zoom, pinch-zoom, and zoom controls. Enable showing multiple branches simultaneously. Animate the series with a smooth staggered animation. The chart should be tall. Use amCharts 5 library.
Demo source