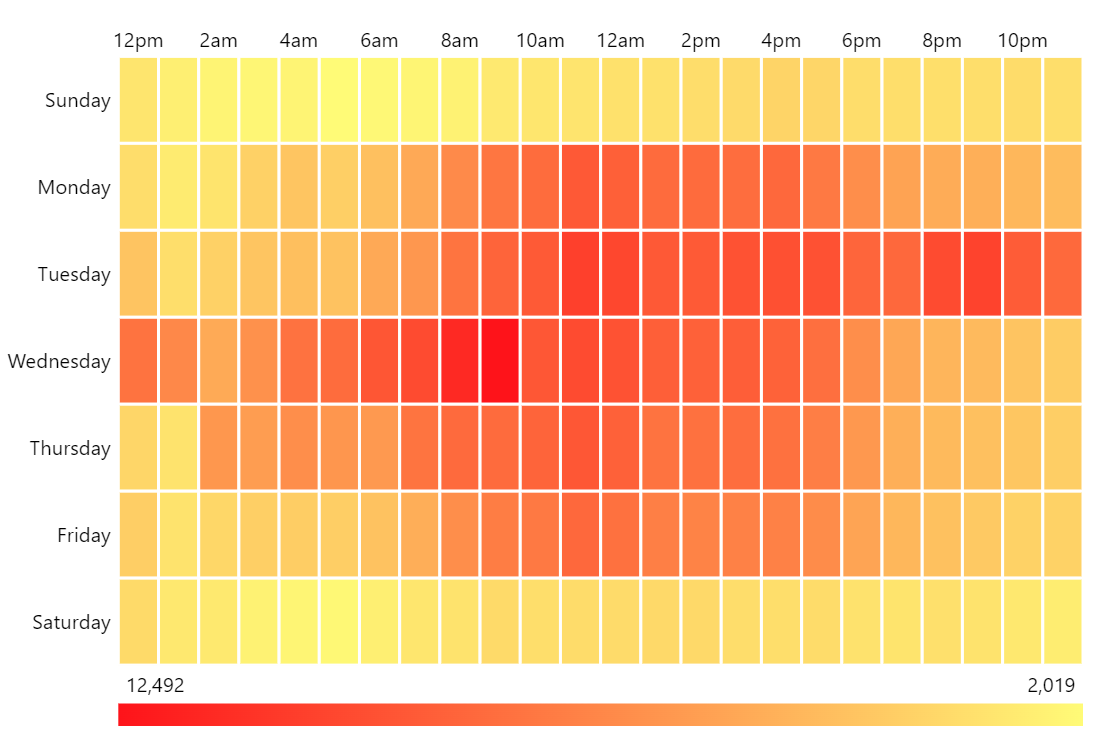
Heat Map with Legend
Heat map (also known as Heatmap, Heat table, Shading matrix) represents data in a rectangular matrix where individual values are differentiated by color.
Heat rules
Heat rules allow modifying element’s properties based on its related value in data, like for instance, color of the columns on this charts.
Heat legend
A perfect companion for any color-based heat maps, a head legend can show the spectrum of values and their relation to colors.
Furthermore, utilizing chart events, it’s possible to further enhance UX by showing exact position of hovered element in the whole spectrum.
Demo source