Nested Donut Chart
Nested donut chart (also known as Multi-level doughnut chart, Multi-series doughnut chart) allows you to display multiple series in a single visualization. The series are usually related but represent different categories or slices of data (like the distribution of some category values over different years, etc.)
Support for multiple series
You can add any number of pie series to the pie chart. The chart will automatically nest them dividing available radius between each series, creating nested donuts.
More about nested donut charts
Build this chart with AI
The prompt below can be used to build this chart with AI. For best coding results, use the most advanced AI models, like Claude Opus 4.6 and GPT-5.3-Codex. For more info and tips, check out amCharts AI docs.
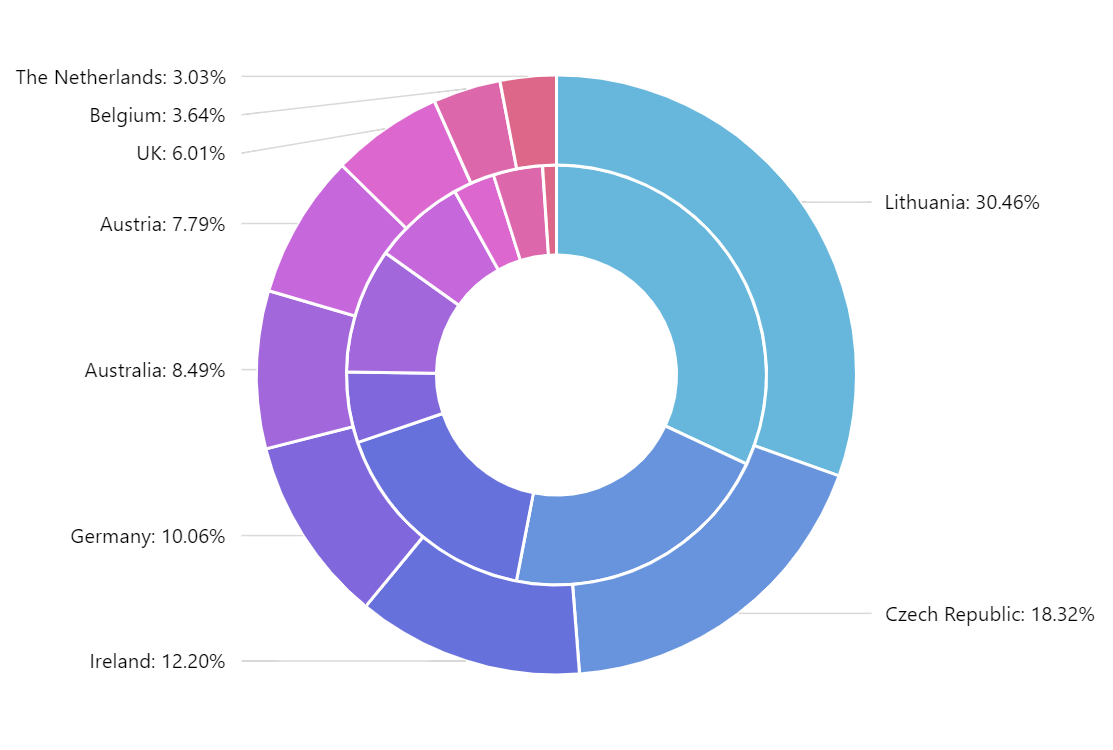
Create a nested donut chart with two concentric ring series displaying beverage consumption data for nine European countries. The inner ring shows bottle counts and the outer ring shows liters consumed. Use a donut-style inner hole. Data includes Lithuania (1500 bottles/501.9 liters), Czech Republic (990/301.9), and seven more countries. Tooltips should display category name, percentage, and absolute value. Slices should scale slightly on hover and are separated by thin borders. Show labels only on the outer ring. Include a smooth animated sequential entrance on load. Use amCharts 5 library.
Demo source