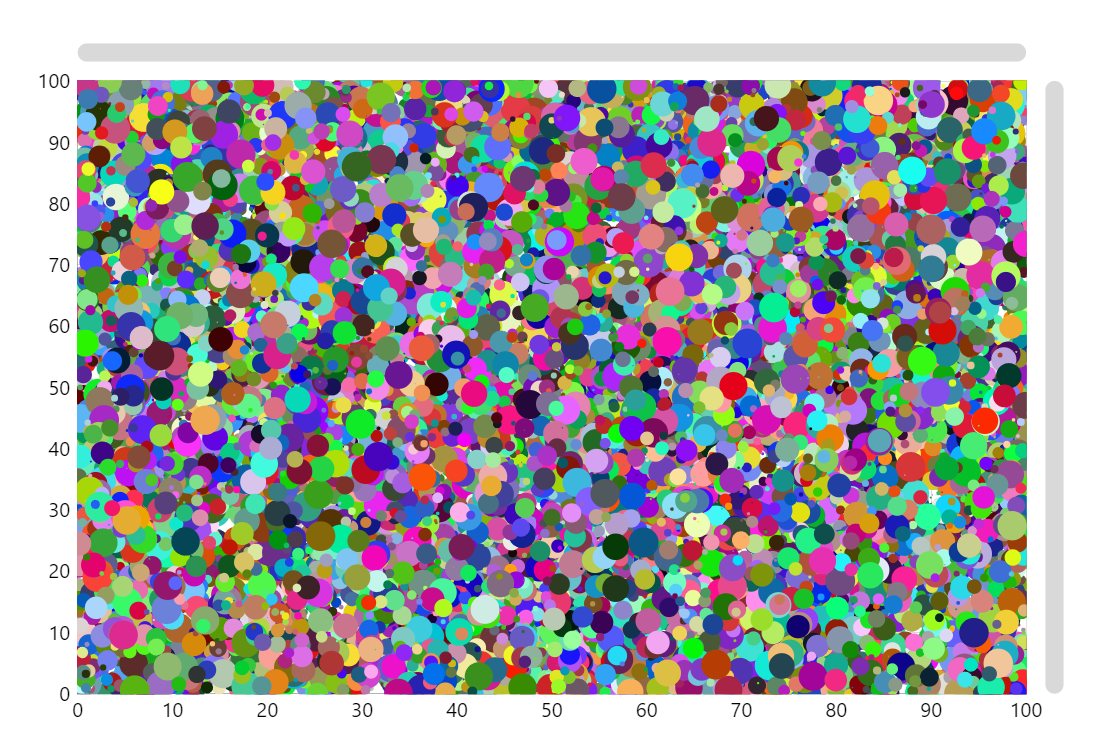
Scatter plot with tens of thousands points
When a chart has a lot of data, it might get slow, especially if you use a separate object, like a bullet for each data item. Each object uses part of the memory so at some point your chart’s performance will get worse. In many such cases there is a solution which will extend amCharts possibilities to display huge data sets many times: instead of creating a separate Bullet object for each data item, we create a single Graphics object and use default drawing capabilities to draw required shapes into this Graphics. You can draw any shape there.
Related tutorials
Build this chart with AI
The prompt below can be used to build this chart with AI. For best coding results, use the most advanced AI models, like Claude Opus 4.6 and GPT-5.3-Codex. For more info and tips, check out amCharts AI docs.
Create a high-performance scatter plot rendering 15,000 data points on an XY chart with numeric axes ranging from 0 to 100 on both axes. Each point should have a randomly generated color and variable size based on its value. Use an optimized rendering approach to handle the large number of points smoothly. Enable pan on both axes, mouse wheel zoom, and pinch zoom. Add a crosshair cursor snapping to the series with tooltips showing x, y, and value. Include horizontal and vertical scrollbars. Animate on load. Use amCharts 5 library.
Demo source