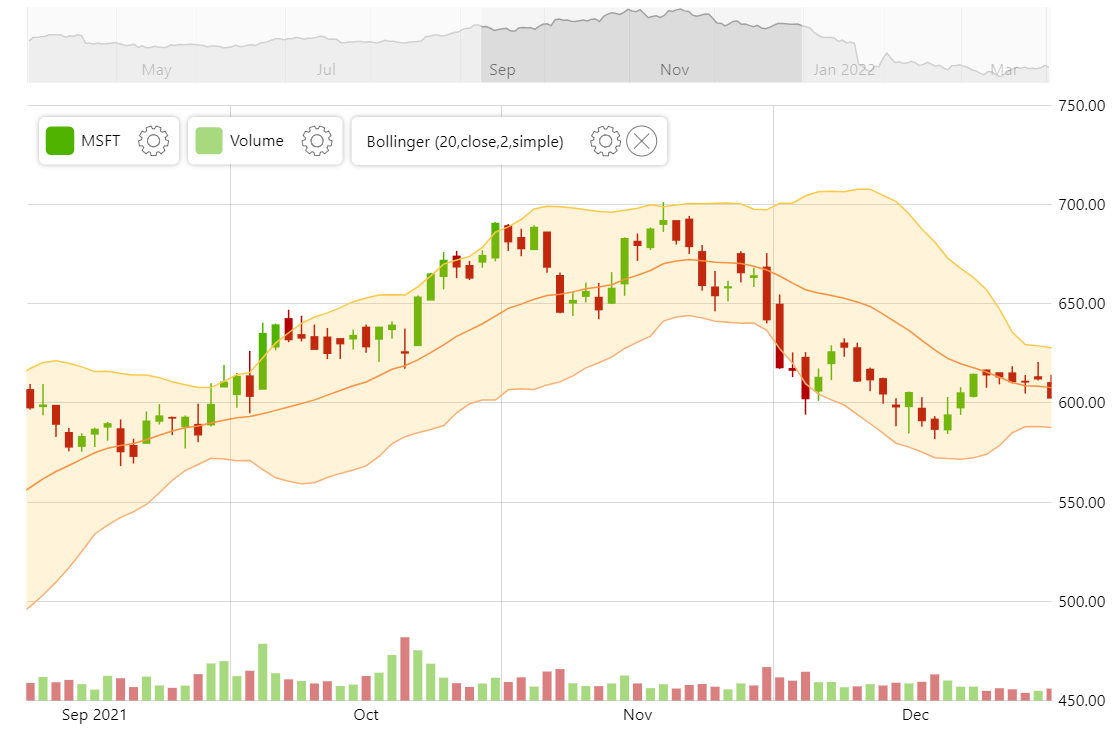
Stock Chart with Bollinger Bands Indicator
Bollinger Band is a technical analysis indicator designed to provide investors with insights to discover oversold and undersold assets.
Bollinger Bands is one of a set of automatic indicators included with amCharts 5: Stock Chart.
Related tutorials
Build this chart with AI
The prompt below can be used to build this chart with AI. For best coding results, use the most advanced AI models, like Claude Opus 4.6 and GPT-5.3-Codex. For more info and tips, check out amCharts AI docs.
Create a stock chart displaying OHLC candlestick data with a volume column series color-coded by price direction (green for up, red for down). Overlay a Bollinger Bands technical indicator showing upper band, lower band, and moving average lines on the main price panel. Include a date axis, a price value axis, and a separate volume axis. Add a scrollbar with a closing-price line preview, a crosshair cursor, and a stock legend. Provide toolbar controls for adding and removing technical indicators, date range selection, period selection, drawing tools, reset, and settings. Apply smooth animations. Use amCharts 5 library.
Demo source