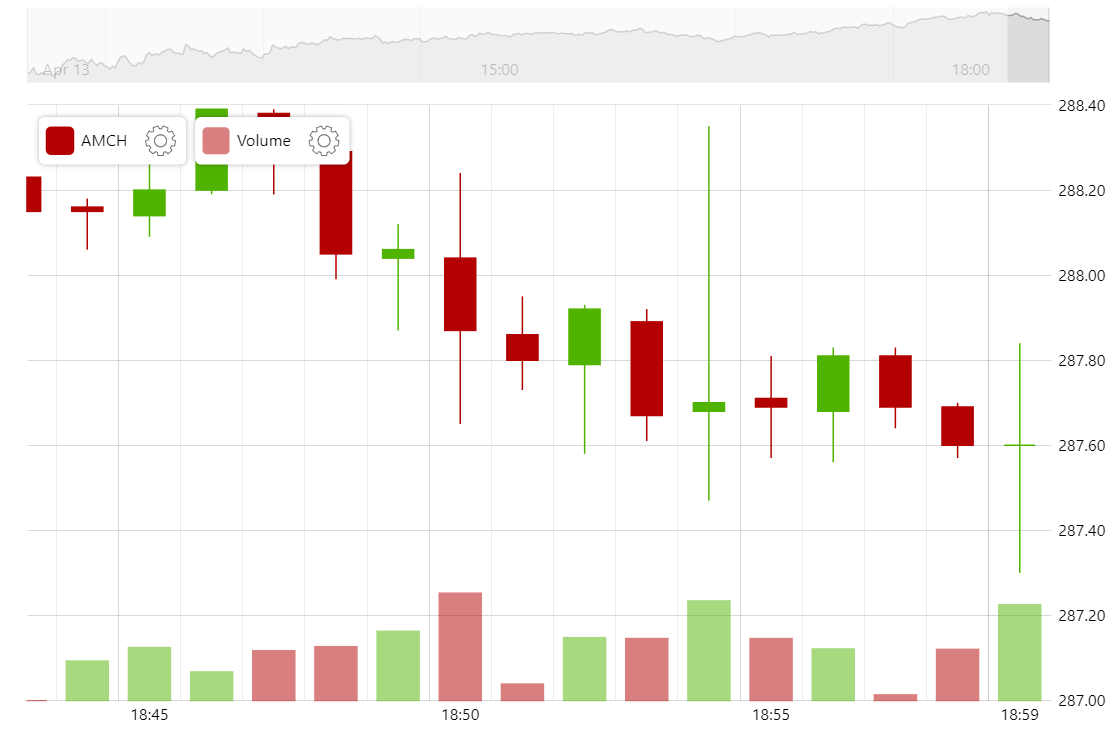
Stock Intraday Data
You can use amCharts Stock Chart to display financial data over a lengthy period of time or just the data from within one day. By using a gapless date axis, you can skip the “holes” in your data to display only the times when there was activity.
Related tutorials
Build this chart with AI
The prompt below can be used to build this chart with AI. For best coding results, use the most advanced AI models, like Claude Opus 4.6 and GPT-5.3-Codex. For more info and tips, check out amCharts AI docs.
Create a stock chart displaying intraday financial data at 1-minute intervals over approximately 24 hours with over 1600 data points. Use a gapless date axis with minute-based intervals to eliminate non-trading period gaps. Display OHLC candlestick data with a slightly transparent volume column series beneath. Include a crosshair cursor, a scrollbar with a line preview, and a stock legend showing formatted OHLC values. Provide toolbar controls for switching series type (Line, Candlestick, OHLC), adding indicators, drawing tools, reset, and settings. Enable panning on both axes and mouse-wheel zoom. Apply smooth animations. Use amCharts 5 library.
Demo source