Stock Data Grouping
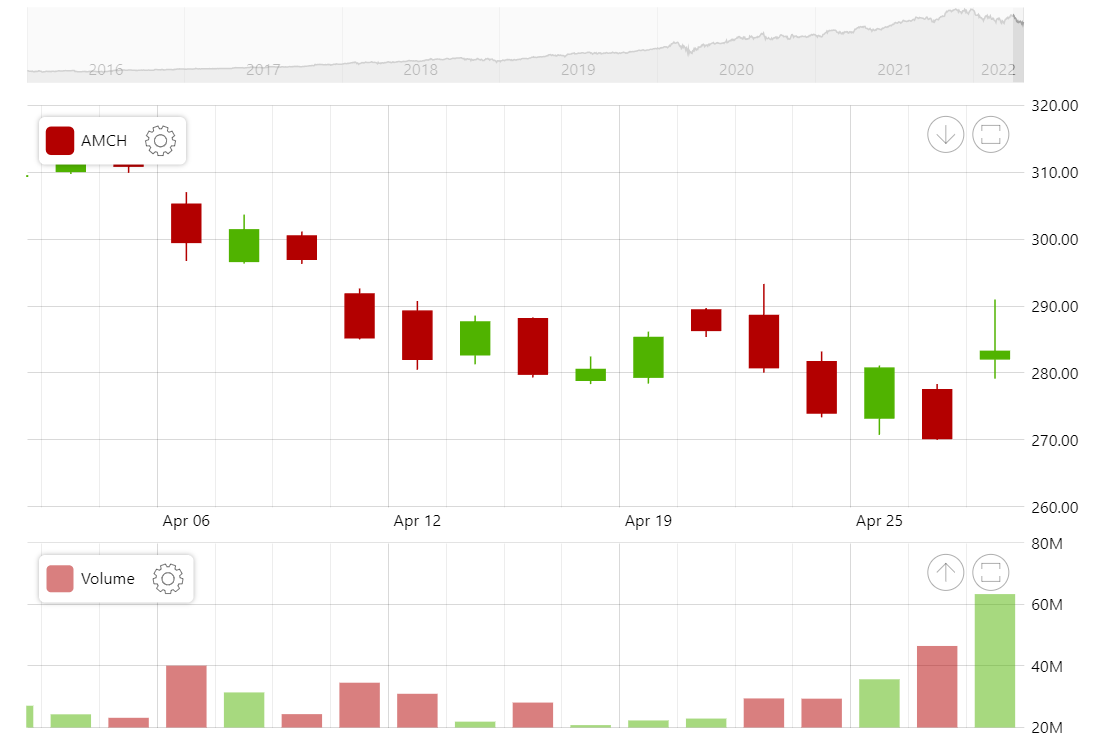
Using the data grouping functions in amCharts 5 Stock Chart can group (aggregate) your data automatically and display easily comprehensible charts based on the current zoom level. Try zooming into the chart above and at several zoom points you will see how data gets more granular once it makes sense to display that level of detail.
Related tutorials
Build this chart with AI
The prompt below can be used to build this chart with AI. For best coding results, use the most advanced AI models, like Claude Opus 4.6 and GPT-5.3-Codex. For more info and tips, check out amCharts AI docs.
Create a stock chart with two synchronized panels: a main candlestick panel (taller) and a volume column panel (shorter). Enable automatic data grouping so that the chart dynamically aggregates data based on zoom level, showing more detail when zoomed in and grouped data when zoomed out. Load daily OHLC data from a CSV file. Each panel should have its own crosshair cursor, stock legend, and value axis. Add a scrollbar with a line preview. Include toolbar controls for indicators, date range, period, drawing, reset, and settings. Apply smooth animations. Use amCharts 5 library.
Demo source