Tag Cloud
Tag cloud (or word cloud, or weighted list) is a visual representation of text data where tag size shows the frequency of the tag in some data set.
Learn how to build Tag clouds with amCharts 5 in this extensive article.
Related tutorials
Build this chart with AI
The prompt below can be used to build this chart with AI. For best coding results, use the most advanced AI models, like Claude Opus 4.6 and GPT-5.3-Codex. For more info and tips, check out amCharts AI docs.
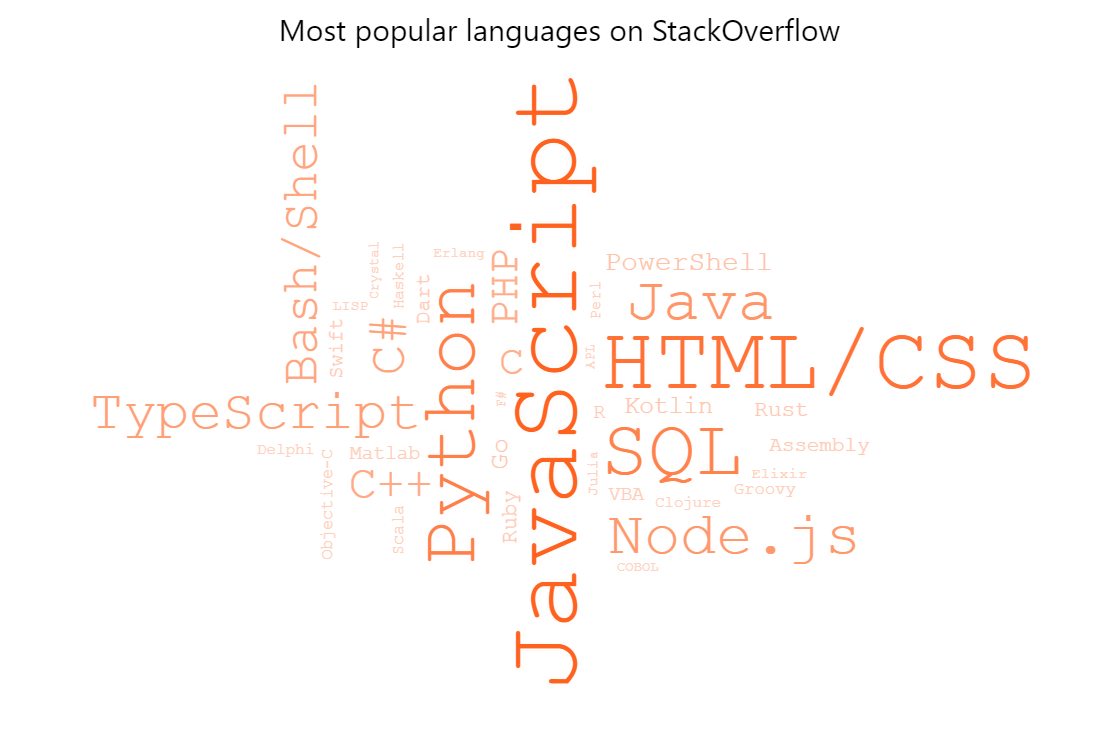
Create a tag cloud displaying the most popular programming languages from the Stack Overflow 2021 survey (39 languages, from JavaScript at 64.96 down to COBOL at 0.53). Size each tag proportionally to its usage percentage. Color each tag based on its value, transitioning from light orange for low values to bright orange for high values. Use Courier New font. Show a pointer cursor on hover. When a tag is clicked, open a Stack Overflow search page filtered for that programming language. Add a centered title above the cloud. Set the container to full width and tall height. Use animated transitions. Use amCharts 5 library.
Demo source