Directed Chord Diagram
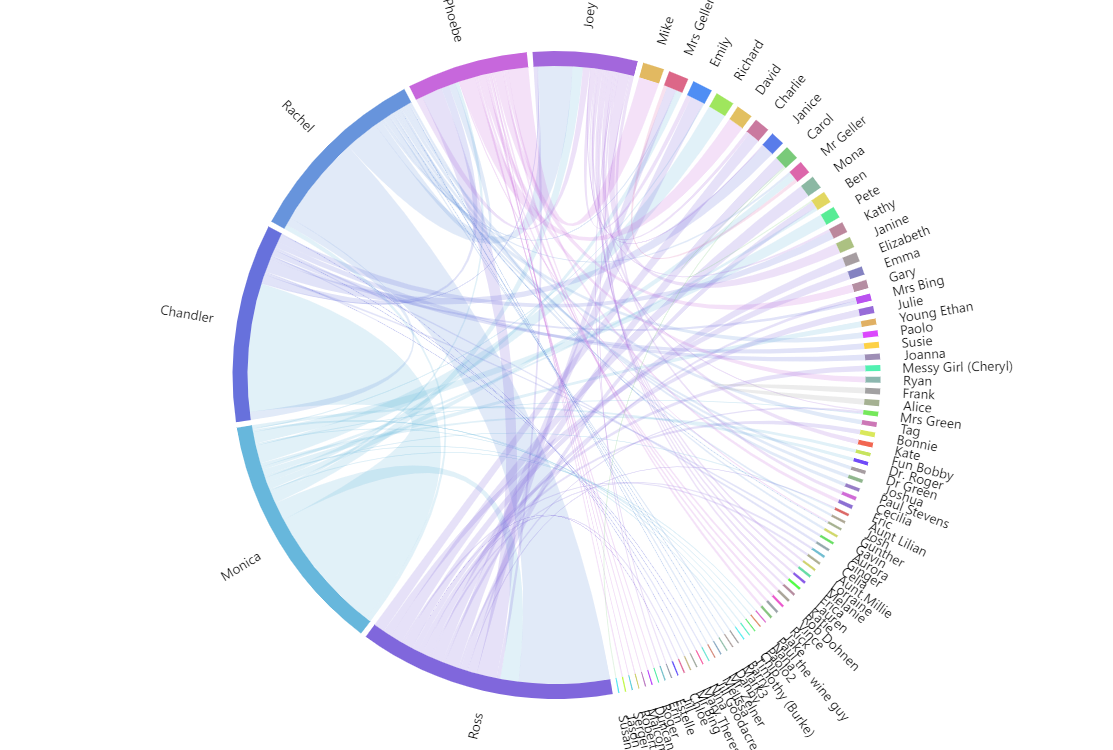
A Directed Chord Diagram is a specialized type of data visualization that represents directed relationships or flows between different entities or categories. It combines the elements of chord diagrams and flow diagrams to show the connections and directional flow between pairs of items. The diagram consists of arcs or chords that connect the entities, with the width or thickness of the arc indicating the strength or intensity of the relationship. The direction of the flow is represented by arrows along the chords. Directed Chord Diagrams are commonly used to visualize complex systems, such as migration patterns, trade flows, or communication networks, where understanding the directional relationships is crucial. They provide a clear and comprehensive representation of the flow and directionality of interactions between various entities, facilitating analysis and insights into the data.
Related tutorials
Build this chart with AI
The prompt below can be used to build this chart with AI. For best coding results, use the most advanced AI models, like Claude Opus 4.6 and GPT-5.3-Codex. For more info and tips, check out amCharts AI docs.
Create a directed chord diagram visualizing interpersonal connections between characters (Monica, Rachel, Chandler, Ross, Joey, Phoebe) from the TV show Friends. Each data entry has 'from', 'to', and numeric 'value' fields. Arrange entities around a circular perimeter with small gaps between segments. Display text labels around the outside. Set chord width proportional to relationship values. Chord colors should be determined by the originating character. Support interactive toggling and filtering of connections. Animate with a smooth staggered animation. The chart should be tall at full width. Use amCharts 5 library.
Demo source