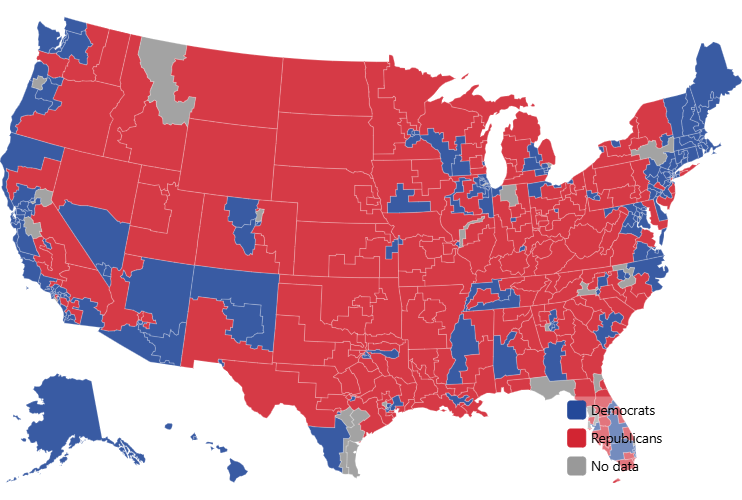
This demo uses a U.S. Congressional Districts map (120th Congress version, 2027–2029) and colors each district by party using “template fields”.
The party colors are example data from an earlier Congress, and districts without data are shown in gray. Replace the data array with your own to map election results or any other district-level values.
Related tutorials
Build this chart with AI
The prompt below can be used to build this chart with AI. For best coding results, use the most advanced AI models, like Claude Opus 5 and GPT-5.6-Codex. For more info and tips, check out amCharts AI docs.
Create an interactive US map displaying all 435 congressional districts of the 120th Congress plus Washington D.C., color-coded by party affiliation using example data. Use blue for Democratic districts, red for Republican districts, and gray for districts without data. Each district should have a unique ID based on state code and district number. Show tooltips displaying the state name, the party name and the district name on hover. Add a legend in the bottom-right corner with a semi-transparent white background listing Democrats, Republicans and No data. Apply the Albers USA projection. Apply smooth animations. Use amCharts 5 library. Use amCharts 5 library.
Demo source