Line With Custom Bullets
A demo of amCharts 3, an older version, no longer developed. For a new project, start from the amCharts 5 demos.
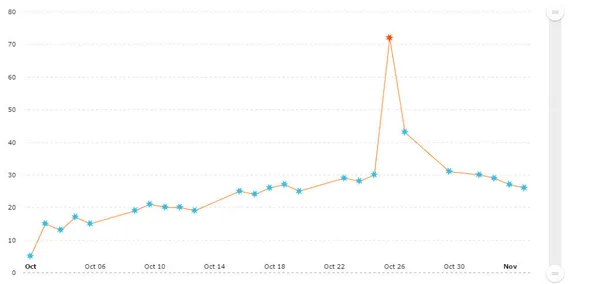
Besides a bunch of predefined bullets (our charts support round, square, triangle, bubble, diamond bullet shapes) you can use your own images as bullets of your graphs. You can set one bullet for all the graph and also use individual bullets for specific data points to indicate some difference of these plots.
Open in:
Code
JavaScript
var chart = AmCharts.makeChart("chartdiv", {
    "type": "serial",
    "theme":"light",
    "dataProvider": [{
        "date": "2009-10-02",
        "value": 5
    }, {
        "date": "2009-10-03",
        "value": 15
    }, {
        "date": "2009-10-04",
        "value": 13
    }, {
        "date": "2009-10-05",
        "value": 17
    }, {
        "date": "2009-10-06",
        "value": 15
    }, {
        "date": "2009-10-09",
        "value": 19
    }, {
        "date": "2009-10-10",
        "value": 21
    }, {
        "date": "2009-10-11",
        "value": 20
    }, {
        "date": "2009-10-12",
        "value": 20
    }, {
        "date": "2009-10-13",
        "value": 19
    }, {
        "date": "2009-10-16",
        "value": 25
    }, {
        "date": "2009-10-17",
        "value": 24
    }, {
        "date": "2009-10-18",
        "value": 26
    }, {
        "date": "2009-10-19",
        "value": 27
    }, {
        "date": "2009-10-20",
        "value": 25
    }, {
        "date": "2009-10-23",
        "value": 29
    }, {
        "date": "2009-10-24",
        "value": 28
    }, {
        "date": "2009-10-25",
        "value": 30
    }, {
        "date": "2009-10-26",
        "value": 72,
        "customBullet": "https://www.amcharts.com/lib/3/images/redstar.png"
    }, {
        "date": "2009-10-27",
        "value": 43
    }, {
        "date": "2009-10-30",
        "value": 31
    }, {
        "date": "2009-11-01",
        "value": 30
    }, {
        "date": "2009-11-02",
        "value": 29
    }, {
        "date": "2009-11-03",
        "value": 27
    }, {
        "date": "2009-11-04",
        "value": 26
    }],
    "valueAxes": [{
        "axisAlpha": 0,
        "dashLength": 4,
        "position": "left"
    }],
    "graphs": [{
        "bulletSize": 14,
        "customBullet": "https://www.amcharts.com/lib/3/images/star.png?x",
        "customBulletField": "customBullet",
        "valueField": "value",
         "balloonText":"<div style='margin:10px; text-align:left;'><span style='font-size:13px'>[[category]]</span><br><span style='font-size:18px'>Value:[[value]]</span>",
    }],
    "marginTop": 20,
    "marginRight": 70,
    "marginLeft": 40,
    "marginBottom": 20,
    "chartCursor": {
        "graphBulletSize": 1.5,
     	"zoomable":false,
      	"valueZoomable":true,
         "cursorAlpha":0,
         "valueLineEnabled":true,
         "valueLineBalloonEnabled":true,
         "valueLineAlpha":0.2
    },
    "autoMargins": false,
    "dataDateFormat": "YYYY-MM-DD",
    "categoryField": "date",
    "valueScrollbar":{
      "offset":30
    },
    "categoryAxis": {
        "parseDates": true,
        "axisAlpha": 0,
        "gridAlpha": 0,
        "inside": true,
        "tickLength": 0
    },
    "export": {
        "enabled": true
    }
});
HTML
<div id="chartdiv"></div>CSS
#chartdiv {
  width: 100%;
  height: 500px;
}
Resources
https://www.amcharts.com/lib/3/amcharts.js
https://www.amcharts.com/lib/3/serial.js
https://www.amcharts.com/lib/3/themes/light.js
https://www.amcharts.com/lib/3/plugins/export/export.min.js
https://www.amcharts.com/lib/3/plugins/export/export.css
All in one page
<!-- Resources -->
<script src="https://www.amcharts.com/lib/3/amcharts.js"></script>
<script src="https://www.amcharts.com/lib/3/serial.js"></script>
<script src="https://www.amcharts.com/lib/3/themes/light.js"></script>
<script src="https://www.amcharts.com/lib/3/plugins/export/export.min.js"></script>
<link rel="stylesheet" href="https://www.amcharts.com/lib/3/plugins/export/export.css">

<!-- Chart code -->
<script>
var chart = AmCharts.makeChart("chartdiv", {
    "type": "serial",
    "theme":"light",
    "dataProvider": [{
        "date": "2009-10-02",
        "value": 5
    }, {
        "date": "2009-10-03",
        "value": 15
    }, {
        "date": "2009-10-04",
        "value": 13
    }, {
        "date": "2009-10-05",
        "value": 17
    }, {
        "date": "2009-10-06",
        "value": 15
    }, {
        "date": "2009-10-09",
        "value": 19
    }, {
        "date": "2009-10-10",
        "value": 21
    }, {
        "date": "2009-10-11",
        "value": 20
    }, {
        "date": "2009-10-12",
        "value": 20
    }, {
        "date": "2009-10-13",
        "value": 19
    }, {
        "date": "2009-10-16",
        "value": 25
    }, {
        "date": "2009-10-17",
        "value": 24
    }, {
        "date": "2009-10-18",
        "value": 26
    }, {
        "date": "2009-10-19",
        "value": 27
    }, {
        "date": "2009-10-20",
        "value": 25
    }, {
        "date": "2009-10-23",
        "value": 29
    }, {
        "date": "2009-10-24",
        "value": 28
    }, {
        "date": "2009-10-25",
        "value": 30
    }, {
        "date": "2009-10-26",
        "value": 72,
        "customBullet": "https://www.amcharts.com/lib/3/images/redstar.png"
    }, {
        "date": "2009-10-27",
        "value": 43
    }, {
        "date": "2009-10-30",
        "value": 31
    }, {
        "date": "2009-11-01",
        "value": 30
    }, {
        "date": "2009-11-02",
        "value": 29
    }, {
        "date": "2009-11-03",
        "value": 27
    }, {
        "date": "2009-11-04",
        "value": 26
    }],
    "valueAxes": [{
        "axisAlpha": 0,
        "dashLength": 4,
        "position": "left"
    }],
    "graphs": [{
        "bulletSize": 14,
        "customBullet": "https://www.amcharts.com/lib/3/images/star.png?x",
        "customBulletField": "customBullet",
        "valueField": "value",
         "balloonText":"<div style='margin:10px; text-align:left;'><span style='font-size:13px'>[[category]]</span><br><span style='font-size:18px'>Value:[[value]]</span>",
    }],
    "marginTop": 20,
    "marginRight": 70,
    "marginLeft": 40,
    "marginBottom": 20,
    "chartCursor": {
        "graphBulletSize": 1.5,
     	"zoomable":false,
      	"valueZoomable":true,
         "cursorAlpha":0,
         "valueLineEnabled":true,
         "valueLineBalloonEnabled":true,
         "valueLineAlpha":0.2
    },
    "autoMargins": false,
    "dataDateFormat": "YYYY-MM-DD",
    "categoryField": "date",
    "valueScrollbar":{
      "offset":30
    },
    "categoryAxis": {
        "parseDates": true,
        "axisAlpha": 0,
        "gridAlpha": 0,
        "inside": true,
        "tickLength": 0
    },
    "export": {
        "enabled": true
    }
});
</script>

<!-- HTML -->
<div id="chartdiv"></div>