amCharts 3 Demos
105 demos of amCharts 3, an older version, no longer developed. For a new project, start from the amCharts 5 demos.
Column & Bar
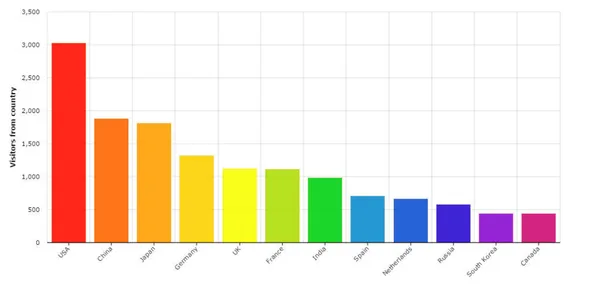 Column With Rotated Series
 Simple Column Chart
 Stacked Column Chart
 GANTT Chart
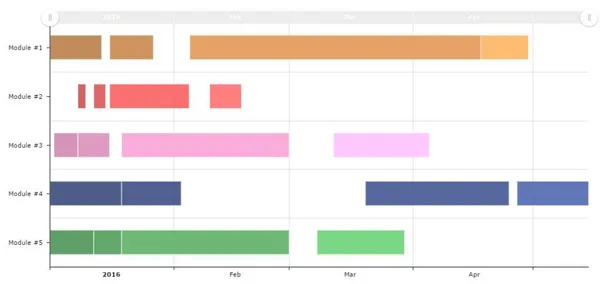 GANTT Chart with dates
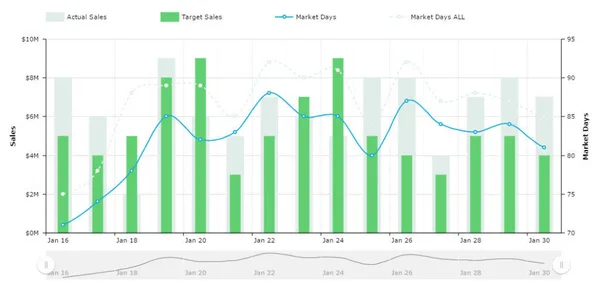
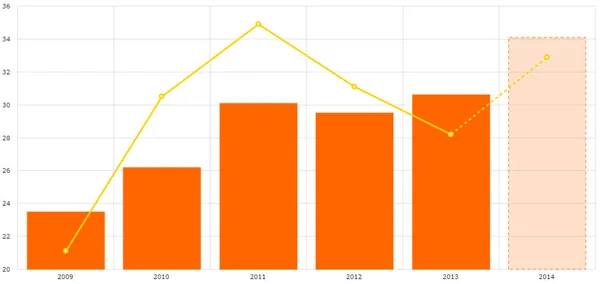 Column and Line mix
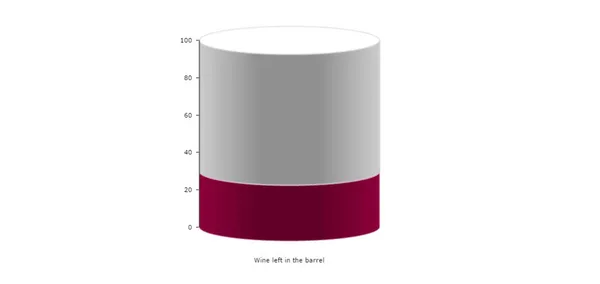
 3D Cylinder Chart
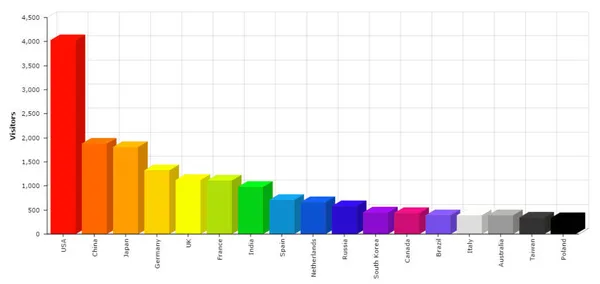
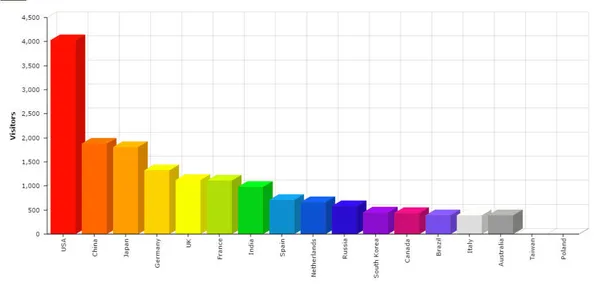 3D Column Chart
 Stacked bar chart with negative values
 Layered Column Chart
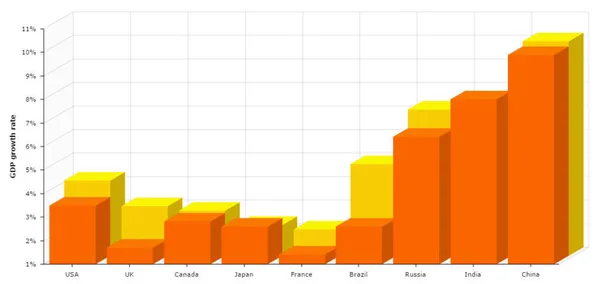 3D Stacked Column Chart
 100% Stacked Column Chart
 Clustered Bar Chart
 Stacked and Clustered Column Chart
 Bar and line chart mix
 Stacked Bar Chart
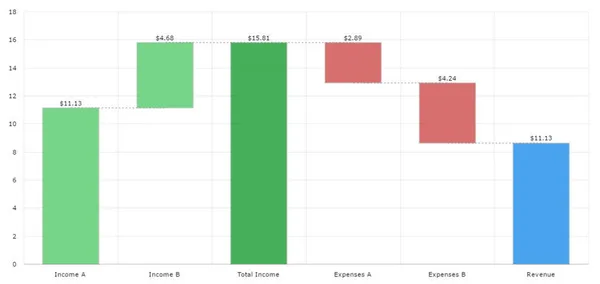
 Floating Bar Chart
 Column chart with images on top
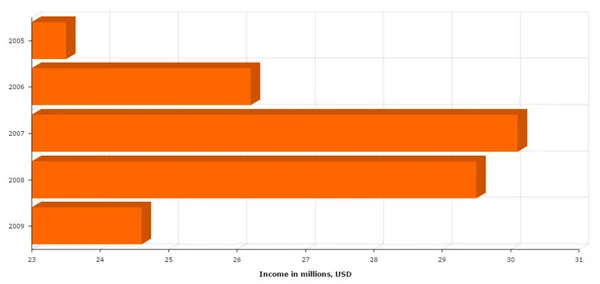 3D Bar Chart
Line & Area
 Date Based Data
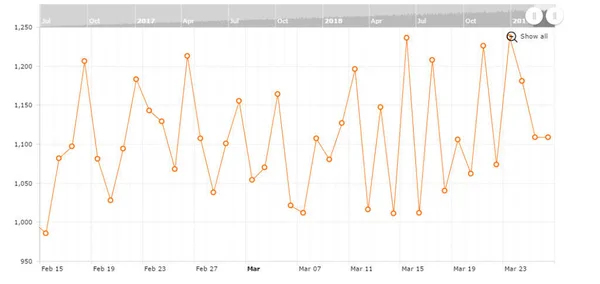 Line Chart with Scroll and Zoom
 Duration on Value Axis
 Line with different colors for ups and downs
 Zoomable Value Axis
 Smoothed Line Chart
 Trend Lines
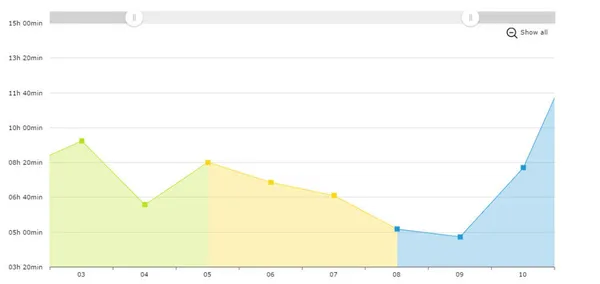 Line With Changing Color
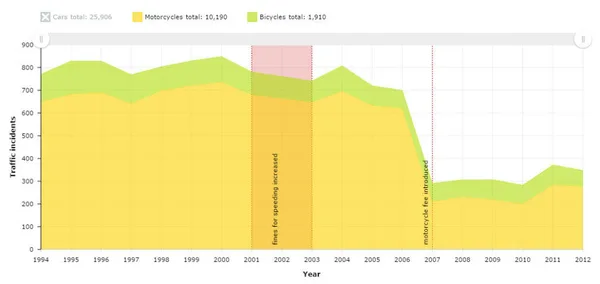 Stacked Area
 100% stacked area chart
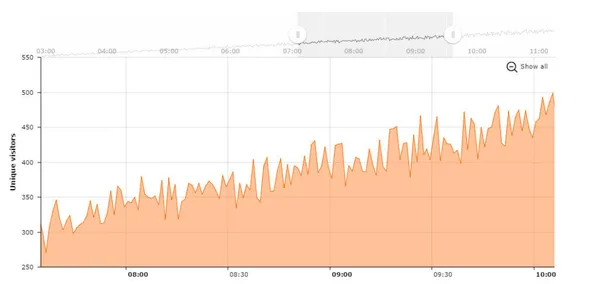 Area With Time Based Data
 Fill between two lines
 Step Line Chart
 Step Line Without Risers
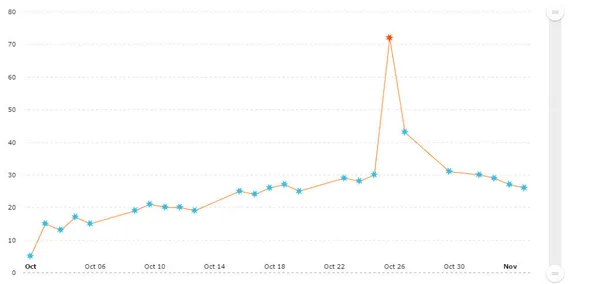 Line With Custom Bullets
 Vertical Line Chart
 Chart With Gaps In Data
 Reversed Value Axis
 Multiple Value Axes
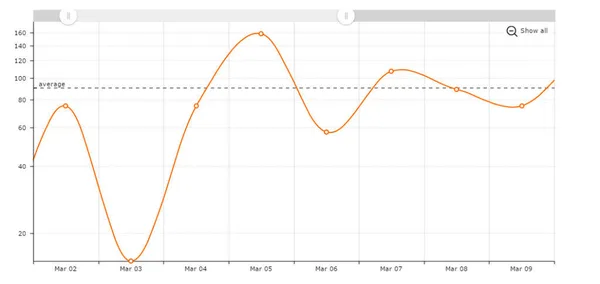 Logarithmic Scale
 Mixed daily and intra-day chart
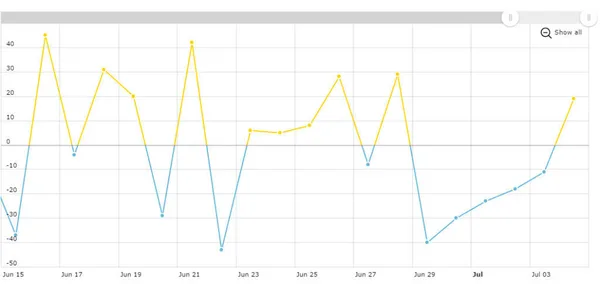 Line with different negative color
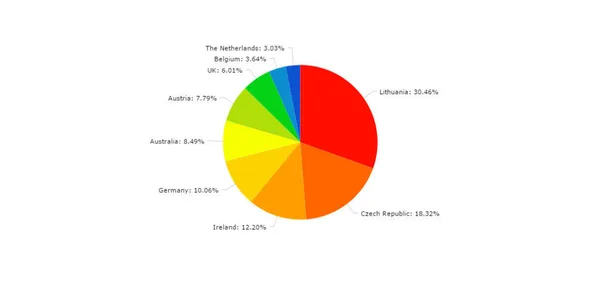
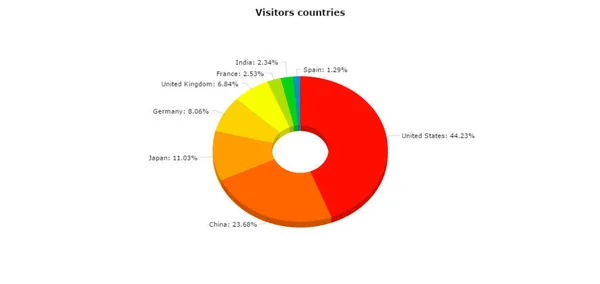
Pie & Donut




XY & Bubble


Maps
 Animations along lines
 Map with curved lines
 Zooming to Countries Map
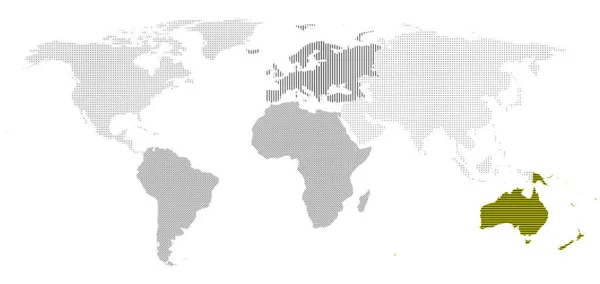 Map With Patterns
 Capitals map
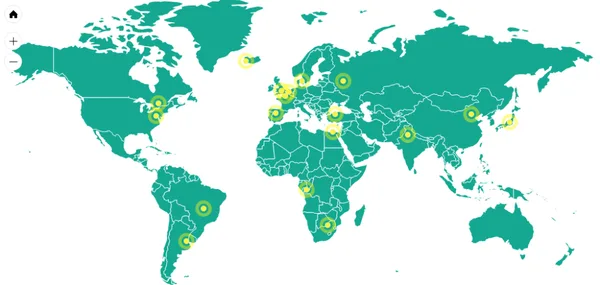 Custom HTML Elements as Map Markers
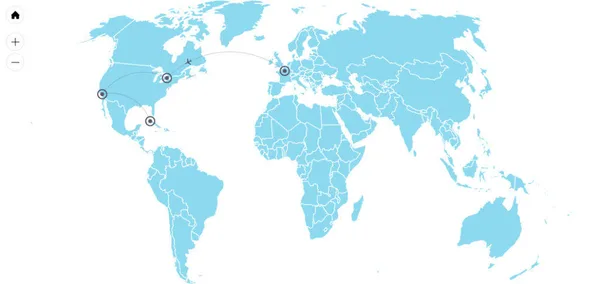
 Flight routes map
 Changing map projection
 Location-sensitive map
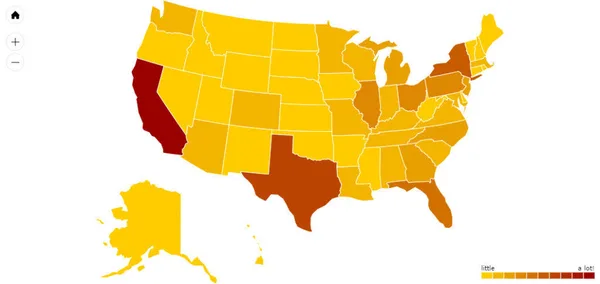 US heat (choropleth) map
 Grouped countries map
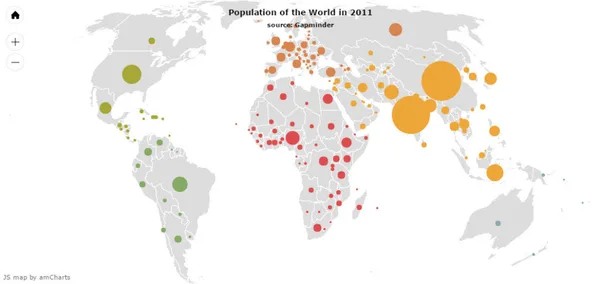 Map with Bubbles
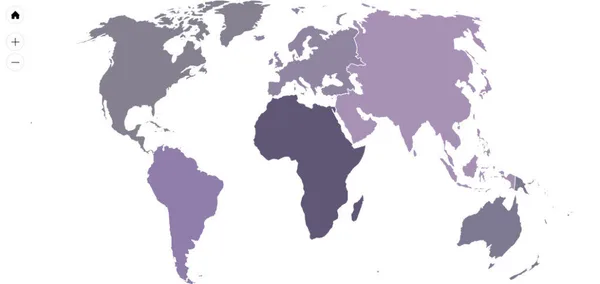 Drill-down Map
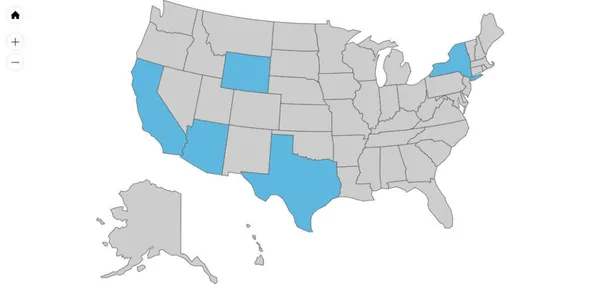 Selecting multiple areas map
 Weather map
 Map with dynamic Pie charts