Radar Chart
A demo of amCharts 3, an older version, no longer developed. For a new project, start from the amCharts 5 demos.
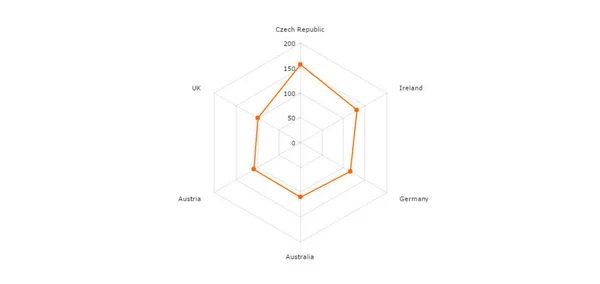
Radar chart displays multivariate data in the form of a two-dimensional chart of more than three variables represented on axes starting from the same point. Radar chart is also called polar chart, spider chart, web chart, star chart or star plot.
Radar chart using amCharts
Our library supports radar chart, and there is a special chart type for it - AmRadarChart. Our radar chart can have any number (more than three) of axes. The grid of radar chart can be made of polygons, like in this example or of circles and this makes it Polar chart
Open in:
Code
JavaScript
var chart = AmCharts.makeChart( "chartdiv", {
  "type": "radar",
  "theme":"light",
  "dataProvider": [ {
    "country": "Czech Republic",
    "litres": 156.9
  }, {
    "country": "Ireland",
    "litres": 131.1
  }, {
    "country": "Germany",
    "litres": 115.8
  }, {
    "country": "Australia",
    "litres": 109.9
  }, {
    "country": "Austria",
    "litres": 108.3
  }, {
    "country": "UK",
    "litres": 99
  } ],
  "valueAxes": [ {
    "axisTitleOffset": 20,
    "minimum": 0,
    "axisAlpha": 0.15
  } ],
  "startDuration": 2,
  "graphs": [ {
    "balloonText": "[[value]] litres of beer per year",
    "bullet": "round",
    "lineThickness": 2,
    "valueField": "litres"
  } ],
  "categoryField": "country",
  "export": {
    "enabled": true
  }
} );
HTML
<div id="chartdiv"></div>CSS
#chartdiv {
  width: 100%;
  height: 500px;
}
Resources
https://www.amcharts.com/lib/3/amcharts.js
https://www.amcharts.com/lib/3/radar.js
https://www.amcharts.com/lib/3/themes/light.js
https://www.amcharts.com/lib/3/plugins/export/export.min.js
https://www.amcharts.com/lib/3/plugins/export/export.css
All in one page
<!-- Resources -->
<script src="https://www.amcharts.com/lib/3/amcharts.js"></script>
<script src="https://www.amcharts.com/lib/3/radar.js"></script>
<script src="https://www.amcharts.com/lib/3/themes/light.js"></script>
<script src="https://www.amcharts.com/lib/3/plugins/export/export.min.js"></script>
<link rel="stylesheet" href="https://www.amcharts.com/lib/3/plugins/export/export.css">

<!-- Chart code -->
<script>
var chart = AmCharts.makeChart( "chartdiv", {
  "type": "radar",
  "theme":"light",
  "dataProvider": [ {
    "country": "Czech Republic",
    "litres": 156.9
  }, {
    "country": "Ireland",
    "litres": 131.1
  }, {
    "country": "Germany",
    "litres": 115.8
  }, {
    "country": "Australia",
    "litres": 109.9
  }, {
    "country": "Austria",
    "litres": 108.3
  }, {
    "country": "UK",
    "litres": 99
  } ],
  "valueAxes": [ {
    "axisTitleOffset": 20,
    "minimum": 0,
    "axisAlpha": 0.15
  } ],
  "startDuration": 2,
  "graphs": [ {
    "balloonText": "[[value]] litres of beer per year",
    "bullet": "round",
    "lineThickness": 2,
    "valueField": "litres"
  } ],
  "categoryField": "country",
  "export": {
    "enabled": true
  }
} );
</script>

<!-- HTML -->
<div id="chartdiv"></div>